

Fintech Statistics: Key Takeaways
- The global fintech market was valued at USD 394.88 billion in 2025 and is projected to reach USD 1,760.18 billion by 2034 at an 18.2% CAGR (Fortune Business Insights).
- Global fintech investment hit USD 103.1 billion across 2,100 deals in H1 2026, putting the sector on pace for its highest annual investment in four years. The ten largest deals accounted for 62% of that total (KPMG Pulse of Fintech H1 2026).
- 80% of adults worldwide now hold a financial account, up from 50% in 2011, yet 1.3 billion adults still have none (World Bank Global Findex 2025).
- Digital wallets handled 56% of global online spend and 33% of in-store spend (Global Payments Report 2026).
- 65% of financial services firms actively use AI, up from 45% a year earlier, and 89% say it has raised revenue or cut costs (NVIDIA State of AI in Financial Services 2026).
- Americans reported USD 20.877 billion in internet crime losses in 2025, up 26%, and crypto related losses passed USD 11 billion (FBI IC3 2025 Internet Crime Report).
- Revolut reached 68.3 million customers and USD 2.3 billion in pre-tax profit in 2025, proof that mobile-first fintech banking can scale and stay profitable (Revolut 2025 annual report).
Fintech is now as much an engineering problem as a financial one. Behind every tap-to-pay, UPI transfer, or instant BNPL approval sits a stack of real-time payment rails, tokenized card credentials, open banking APIs, KYC and AML pipelines, and ML models that score transactions as they happen. Adoption of that stack is moving fast. Wallets handle 56% of global online spend, UPI averages over 800 million transactions a day, and 65% of financial services firms now actively use AI.
Failure to succeed is also reflected in the figures: US internet crime losses hit USD 20.877 billion by 2025, 85% of which was due to cyber-enabled fraud, while investments are increasingly flowing into scalable platforms that already have their compliance, security and integration sorted out. For companies developing payment applications, neobanks and AI-powered risk management tools, these are all factors that now make the difference between a product’s success and its failure.
Figures coming from primary sources like audit firms, law enforcement, and development forecasts are labeled as such. All information is based on the release of information in October 2026, and any figures stated as projected or forecasted information are estimates, including the market size in 2026 and all 2030 and 2034 figures.
What Is the Fintech Industry?
Fintech, short for financial technology, is the use of software, data, and connectivity to deliver financial services faster, cheaper, or to more people than traditional channels can. If you want a quick fintech industry overview, these are the main segments:
- Payments: tap-and-go payments, real-time payments rail, wallets, cross-border transactions
- Digital banking: neo-banks, mobile-first financial technology banking applications
- Lending: Buy Now Pay Later(BNPL), online lending, alternative credit scoring
- Wealth and insurance: robo-advisors, investing apps, insurtech
- Digital assets: crypto, stablecoins, tokenization
- Infrastructure: APIs, regtech, fraud and identity tools
Global Fintech Market Size and Growth
Let’s start with the number everyone asks for. The global fintech market was valued at USD 394.88 billion in 2025 and is projected to reach USD 1,760.18 billion by 2034.
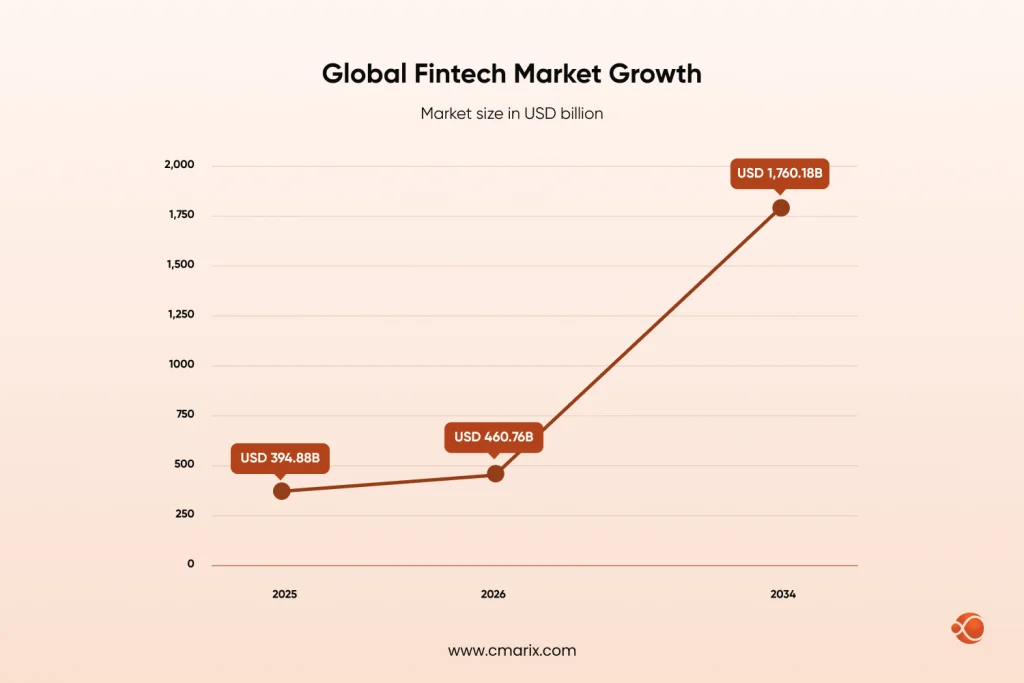
| Year | Global fintech market size | Status |
| 2025 | USD 394.88 billion | Valued |
| 2026 | USD 460.76 billion | Projected |
| 2034 | USD 1,760.18 billion | Projected, 18.2% CAGR |
The 2025 to 2026 step alone adds about USD 65.88 billion. North America holds the largest regional share at roughly USD 127.52 billion. One caution on fintech market research: publishers define the market differently, so totals swing widely from report to report. Always name the publisher and the year when you quote one.
Fintech Adoption and Consumer Statistics
Here is how people actually use financial services, based on a survey of adults in 141 economies.
| Metric | Figure |
| Adults with an account, 2024 | 79% (74% in 2021, 51% in 2011) |
| Adults still without an account | 1.3 billion |
| Adults who own a mobile phone | 86%, including 68% with a smartphone |
| Adults making or receiving digital payments in low- and middle-income economies | 61% |
| Adults globally with a mobile money account | 15% |
| Sub-Saharan Africa, mobile money accounts | 40% (27% in 2021) |
| Sub-Saharan Africa, account ownership | 58% (49% in 2021) |
| Account ownership, women vs men | 77% vs 81% |
Source: (Financial Inclusion 2025)
Phones did most of the work here. Mobile money drove much of the gain in low- and middle-income economies, so the next wave of fintech users will likely come from markets where a bank branch was never the default.
Fintech Funding and Investment Statistics
These totals cover venture capital, private equity, and M&A together. Investment rebounded sharply, but capital is flowing to fewer, larger bets.
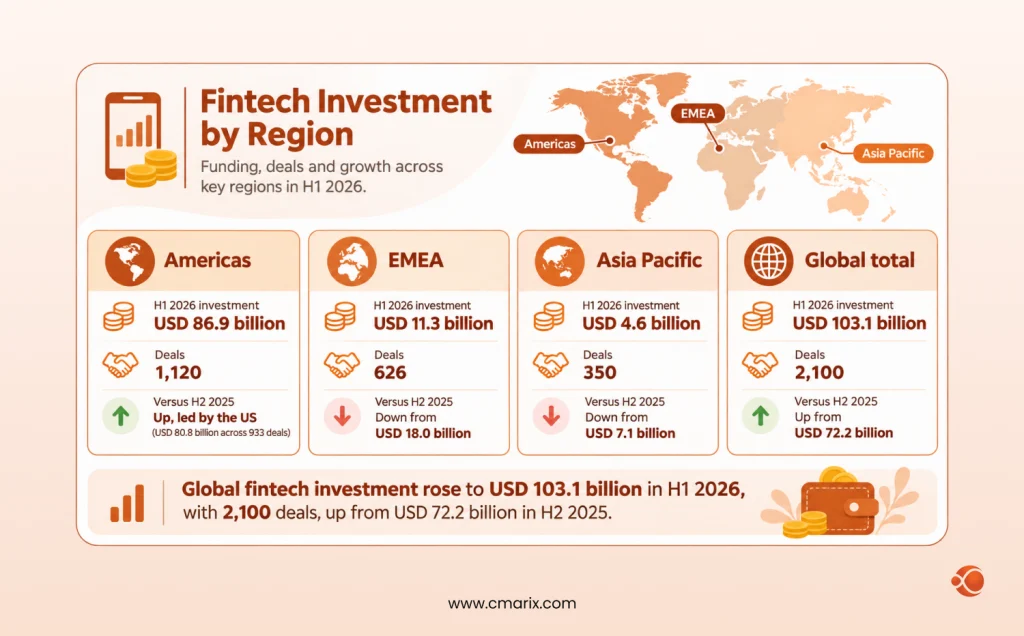
| Region | H1 2026 investment | Deals | Versus H2 2025 |
| Americas | USD 86.9 billion | 1,120 | Up, led by the US (USD 80.8 billion across 933 deals) |
| EMEA | USD 11.3 billion | 626 | Down from USD 18.0 billion |
| Asia Pacific | USD 4.6 billion | 350 | Down from USD 7.1 billion |
| Global total | USD 103.1 billion | 2,100 | Up from USD 72.2 billion |
A few numbers explain the shape of this rebound:
- Deal count fell from 2,500 in H2 2025 to 2,100 in H1 2026
- The ten largest deals totaled USD 64 billion, or 62% of all investment
- Payments led by sector at USD 44.2 billion across 168 deals, anchored by Global Payments’ USD 24.3 billion acquisition of Worldpay
- The UK drew USD 2.5 billion across 205 deals. In pounds, that is GBP 1.8 billion, down about two-thirds from GBP 5.0 billion in H1 2025
- Singapore drew USD 499 million across 53 deals, down from USD 1.45 billion across 97 deals in H1 2025
Venture-only data tells a similar story, just on a smaller scale. CB Insights reports that fintech companies raised USD 52.7 billion in 2025, up 35.5% from USD 38.9 billion in 2024, and took 11% of all global venture funding, second only to AI. Keep the two datasets separate, because the first includes private equity and M&A while this one tracks private market venture funding.
Digital Payments and Tap to Pay Statistics
Payments is the largest fintech segment by investment and by transaction value. A 42 market study surveying more than 63,000 consumers provides the clearest view.
| Market | Wallet share of online spend | Wallet share of in-store spend |
| Global | 56% | 33% |
| Asia Pacific | 77% | 63% |
| India | 68% | 61% |
| United States | 39% | 17% |
- Wallets accounted for more than USD 13.8 trillion in combined online and in-store spend in 2025
- The report forecasts wallet share rising to 63% online and 42% in-store by 2030
- Asia Pacific wallets handled USD 2.7 trillion online and USD 6.3 trillion in person
- Statista projects mobile POS payments at USD 28.32 trillion in 2026, the largest segment of digital payments, and its definition includes contactless payments at the point of sale
Contactless payment is no longer just a unique feature. It is the baseline users expect.
India shows what real-time rails can do at national scale. The UPI numbers for September 2026:
| Metric | Figure |
| Transactions, September 2026 | 24.07 billion |
| Value, September 2026 | Rs 29.37 lakh crore |
| Year on year growth | 23% in volume, 18% in value |
| Daily average | 802 million, the first month above 800 million |
| Record month | 24.51 billion transactions in August 2026 |
Our engineers build secure, compliant payment apps from idea to launch.
Neobank, BNPL, and Digital Lending Statistics
Revolut is the cleanest proof that fintech banking can scale and make money at the same time. Its 2025 annual report shows:
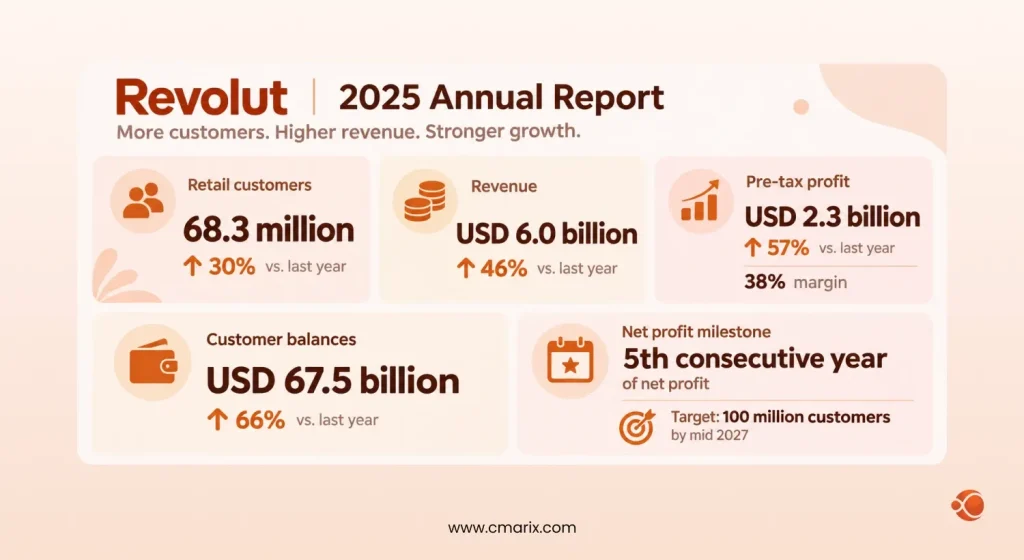
Buying now and paying later is another consumer story. Klarna’s Q2 2026 earnings release gives a good read on where it stands.
| Metric | Klarna Q2 2026 |
| Gross merchandise volume | USD 36.6 billion, up 18% |
| Active consumers | 120 million, up 8% |
| Merchants | 1.2 million plus, up 54% |
| Credit loss provisions | 0.52% of GMV |
| US GMV | USD 7.9 billion, up 27% |
Affirm reported GMV of USD 13.8 billion for the quarter ended 31 December 2025, up 36% year on year. Both companies are pushing into everyday spending through cards and memberships, which is a sign that BNPL is turning into a general-purpose credit product.
AI and Machine Learning in Banking Statistics
AI in banking has moved from pilot projects to profit and loss statements. A survey of more than 800 industry professionals found:
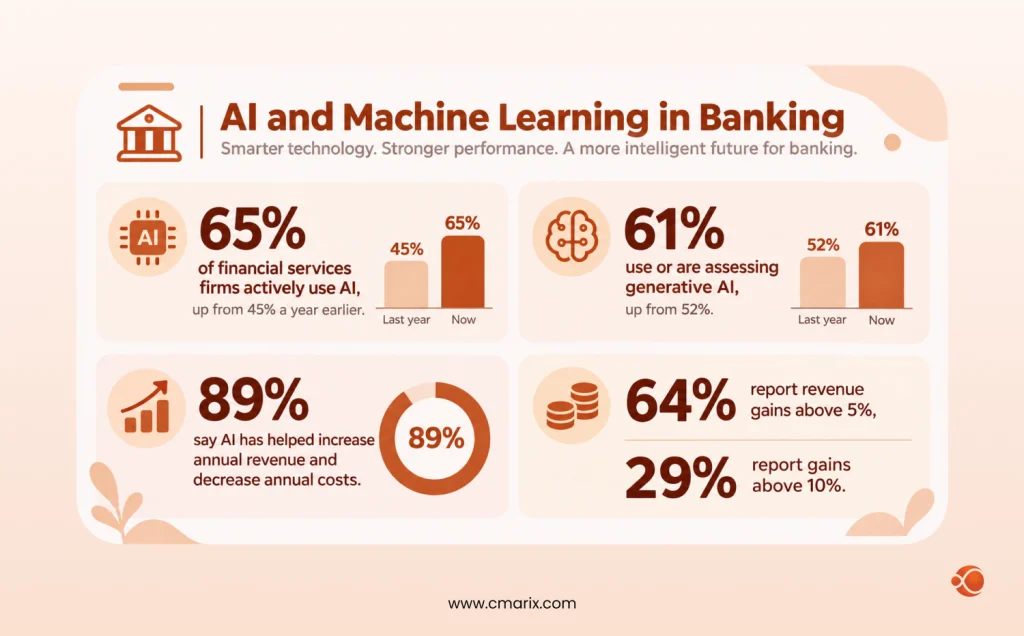
- 65% of financial services firms actively use AI, up from 45% a year earlier
- 61% use or are assessing generative AI, up from 52%
- 89% say AI has helped increase annual revenue and decrease annual costs
- 64% report revenue gains above 5%, and 29% report gains above 10%
The fintech firm survey cited earlier points the same way. About 8 in 10 firms deploy AI, 83% report a better customer experience, and about 75% report cost savings and higher profitability.
| Use case | What AI or machine learning does |
| Fraud detection | Scores transactions in real time and flags unusual patterns |
| Risk management | Models credit, market, and liquidity exposure |
| Credit decisions | Reads alternative data to score thin file borrowers |
| Document processing | Extracts and checks data from IDs, statements, and contracts |
| Customer service | Automates support and onboarding conversations |
Machine learning for fintech is strongest where data is plentiful and decisions repeat thousands of times a day. That is why fraud scoring and credit decisions lead the list.
Turn your AI banking idea into a working, production ready product.
Emerging Technologies in Financial Services
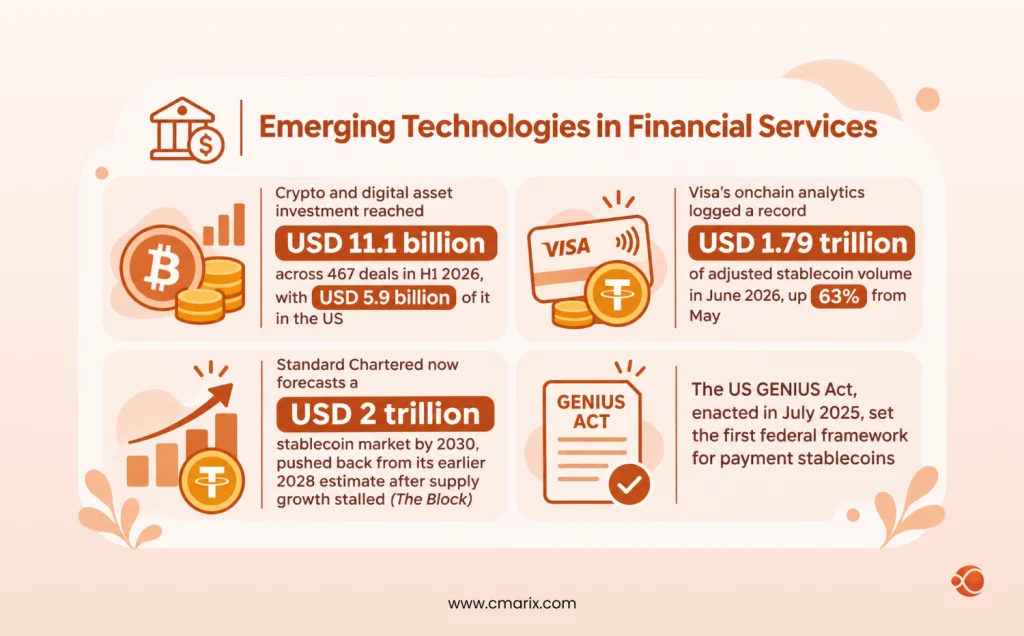
Stablecoins and digital assets are the emerging technologies in financial services getting the most capital and the most regulatory attention.
- Crypto and digital asset investment reached USD 11.1 billion across 467 deals in H1 2026, with USD 5.9 billion of it in the US
- Visa’s onchain analytics logged a record USD 1.79 trillion of adjusted stablecoin volume in June 2026, up 63% from May
- Standard Chartered now forecasts a USD 2 trillion stablecoin market by 2030, pushed back from its earlier 2028 estimate after supply growth stalled (The Block)
- The US GENIUS Act, enacted in July 2025, set the first federal framework for payment stablecoins
Open banking and open finance are the quieter shift. The same fintech survey calls them a significant milestone for the sector, mainly because they let fintechs plug into incumbents through APIs instead of competing head-on.
Fintech Fraud, Cybersecurity, and Compliance Statistics
More digital money means more digital crime. The latest US complaint data was published in April 2026.
| Metric (United States, 2025) | Figure |
| Total complaints | 1,008,597 (up from 859,532 in 2024) |
| Reported losses | USD 20.877 billion, up 26% |
| Investment fraud losses | USD 8.6 billion |
| Crypto related losses | USD 11.366 billion across 181,565 complaints |
| Crypto investment fraud | USD 7.2 billion |
| Business email compromise | USD 3.0 billion |
| Cyber-enabled fraud | USD 17.7 billion, about 85% of all losses |
| AI-related complaints | 22,364, with USD 893 million in losses |
| Losses reported by Americans over 60 | About USD 7.7 billion |
The pattern is clear. Investment scams and crypto drive the biggest losses, and AI shows up in the data for the first time. For fintech teams, a compliance scorecard should at least track:
- KYC completion and drop-off rates
- AML alert volume and false positive rate
- Time to review and close alerts
- Fraud loss rate against transaction value
- Dispute and chargeback rates
- Time to detect and report a security incident
Fintech Digital Transformation: Options for Legacy Banks
Fintech digital transformation is no longer a question of whether. It is a question of how. Legacy banks have three realistic paths.
| Path | Best for | Main trade-off |
| Build | Banks with strong engineering and a clear product edge | Highest cost and the slowest time to market |
| Partner | Banks that want speed and new customer segments | Shared margin and less control of the experience |
| Buy | Banks that need a license, a user base, or a capability fast | Integration risk and a high purchase price |
Partnering is where the market is heading. 84% of the fintechs in that survey already work with incumbent institutions, and the current deal climate is a consolidation phase where investors favor scaled infrastructure.
Fintech Trends to Watch in 2027
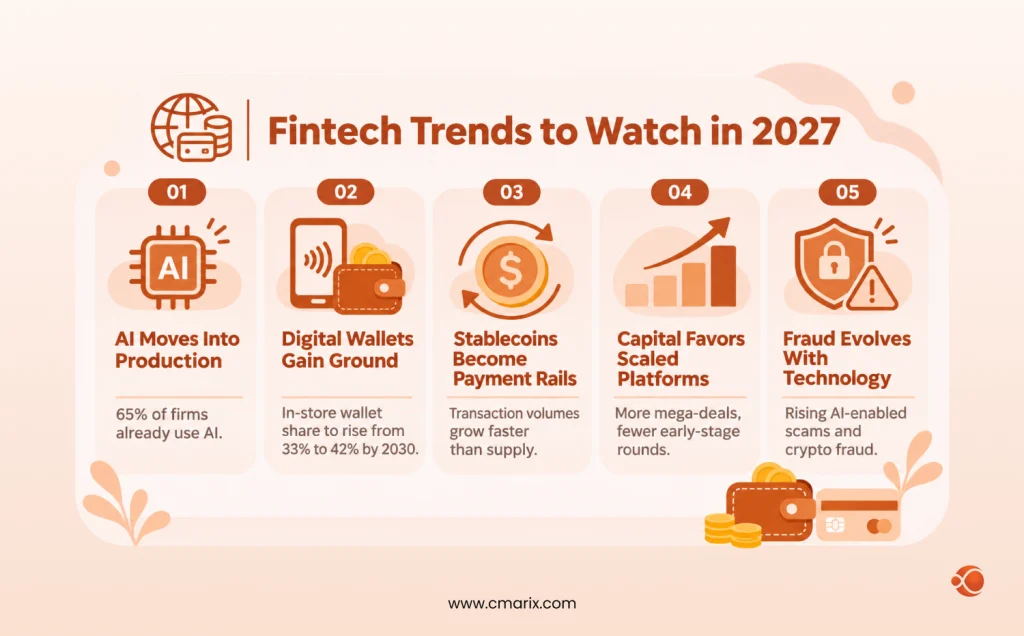
If you are tracking financial technology trends and the future of finance, these five are worth planning around.
- AI moves into production workflows. With 65% of firms already using AI, the question shifts from pilots to governance and measurable return.
- Wallets take over the store. Global in-store wallet share is forecast to climb from 33% to 42% by 2030.
- Stablecoins become payment rails. Volume is growing faster than supply, and bank-issued products are arriving.
- Capital concentrates in scaled platforms. Expect more mega deals and fewer early-stage rounds.
- Fraud keeps pace with technology. Fraud facilitated by AI and crypto fraud are evident in FBI data.
These fintech market trends point to the same future of fintech: fewer experiments, more infrastructure, and tighter security.
Cost to Develop a Fintech App
Cost is another question for most teams reading a trends report. The cost range below are indicative estimates for planning. Final pricing depends on region, scope, compliance needs and integrations.
| Tier | Typical scope | Timeline | Estimated cost |
| MVP | One core flow, basic KYC, one payment method | 3 to 5 months | USD 45,000 to USD 90,000 |
| Mid-market | Multiple payment methods, ML fraud checks, admin dashboard | 5 to 9 months | USD 90,000 to USD 250,000 |
| Enterprise | Core banking integration, multi-region compliance, custom analytics | 9 to 18 months | USD 250,000 to USD 600,000+ |
Three things move the number most: compliance depth (KYC, AML, PCI DSS), integration count (banks, card networks, NFC tap to pay, credit bureaus), and how much machine learning sits inside the product.

Why Choose CMARIX for Finance Software Development
The numbers in this guide point to one build list: faster payments, safer money movement, and AI that earns its place. Here is how that maps to what CMARIX delivers for fintech teams.
| What the data shows | What we build |
| Wallets and tap to pay are becoming the default | NFC and wallet payment apps with real time settlement |
| Fraud losses keep climbing | ML-based fraud scoring, KYC, and AML workflows |
| Banks keep partnering with fintechs | Custom banking software development with API and core banking integration |
| AI is paying off in production | ML models for credit decisions and document processing |
We have delivered software since 2009, and our processes are ISO 9001:2015 and ISO 27001 certified, which matters when you handle financial data. Planning a product in this space? Start with a scoped estimate, not a guess.
Conclusion
Fintech is no longer a bet on whether digital finance works. A market projected to reach USD 1.76 trillion by 2034, 79% of adults with an account, and wallets already handling most online spend settle that question.
What has changed is the standard for developing. Money now favors scaled, proven platforms, AI has to show a return, and fraud losses are increasing right along with adoption. And those companies who has realized that security, compliance, and payments are a part of the product, not an afterthought, are the ones that will make it to 2027.
If you are planning a payment app, a digital banking product, or an AI feature for an existing platform, test your roadmap against the numbers in this guide before you commit a budget.
FAQs on Fintech Statistics
What do the latest fintech statistics indicate about global consumer adoption?
79% of adults held a financial account in 2024, up from 51% in 2011, and 86% own a mobile phone. Digital wallets handled 56% of global online spend in 2025. Still, 1.3 billion adults remain without an account, so the adoption gap is real.
What are the most defining financial technology trends for the upcoming year?
The trends are AI is moving into production, wallet penetration in brick-and-mortar shops, stablecoin payment rails, and capital flowing to scalable platforms. The speed of development will depend on fraud and compliance.
What is the total projected fintech market size globally?
The market was valued at USD 394.88 billion in 2025 and is projected at USD 460.76 billion in 2026 and USD 1,760.18 billion by 2034. Other publishers use different definitions and publish different totals.
How is fintech digital transformation restructuring traditional asset management?
AI agents now support work from back office tasks to investment research, and investing products sit inside mobile-first apps. Revolut’s wealth products alone earned about USD 876 million in 2025 revenue. Tokenized funds and digital asset rails are the next layer.
What options do legacy banks have when adapting to future of finance predictions?
They can build, partner, or buy. Partnering is the most common route, since 84% of surveyed fintechs already work with incumbent financial institutions.
What are the biggest operational roadblocks highlighted in a recent fintech industry report?
H1 2026 data shows capital concentrating in a few large deals, with deal count falling from 2,500 to 2,100. UK investment dropped to GBP 1.8 billion from GBP 5.0 billion. Fraud losses and regulatory uncertainty add to the pressure.
How does the performance of mobile-first fintech banking compare to brick-and-mortar ecosystems?
There is no single global benchmark. Revolut’s numbers give one data point: 30% customer growth and a 38% pre-tax margin in 2025. Compare any fintech result against incumbents in the same market.
What sectors are showing the highest venture capital inflows within the global fintech market?
Payments led H1 2026 with USD 44.2 billion across 168 deals, followed by crypto and digital assets at USD 11.1 billion across 467 deals. AI is expected to remain a top priority for investors.
What core compliance metrics should be prioritized according to fintech market research specialists?
Reports do not agree on one standard scorecard. Based on the loss patterns in FBI data, track KYC completion, AML alert false positives, alert review time, fraud loss rate, dispute rates, and incident response time.
Where can growing enterprise teams obtain specialized, secure neo-banking infrastructure solutions?
Look for a development partner with proven security certifications and banking integration experience. CMARIX builds custom banking software, payment platforms, and neobank infrastructure for startups and enterprises.