Quick Summary: Data science combines statistics, programming, and business thinking to turn raw data into decisions. This data science guide walks through what it actually is, how the data science lifecycle works step by step, the tools and skills you need, and how it shows up across industries. You’ll also see how companies decide between building an in-house data science team and outsourcing the work entirely.
There is no business entity in today’s world that does not have too much data to handle. Behavior of customers, transaction data, app usage information, sensor outputs – everything keeps pouring in at such a pace that most companies cannot make any use of it. The point is not in the absence of data anymore. The real issue is in the difference between having and utilizing it.
That’s where data science comes in, and that’s also where most confusion starts. People throw around terms like analytics, machine learning, and AI as if they’re interchangeable. They’re not. Data science sits at the intersection of statistics, coding, and business strategy, and understanding how those three pieces fit together is the first step to using it well, whether you’re learning it yourself or trying to staff a team around it.
What Is Data Science? Definition and Core Concept
Data science is the practice of extracting useful information from structured and unstructured data using statistical methods, domain knowledge, and programming. It’s not about running numbers through a spreadsheet. It includes collecting data, cleaning it, analyzing patterns, developing predictive models, and then communicating what those models mean in terms that a business can act on.
It is like a bridge where on one end you have your unrefined and untidy data, while on the other end you have the decision that needs to be made, whether the customer might leave or how much inventory should be ordered for the next quarter. Data science is the entire process that takes place in the middle.
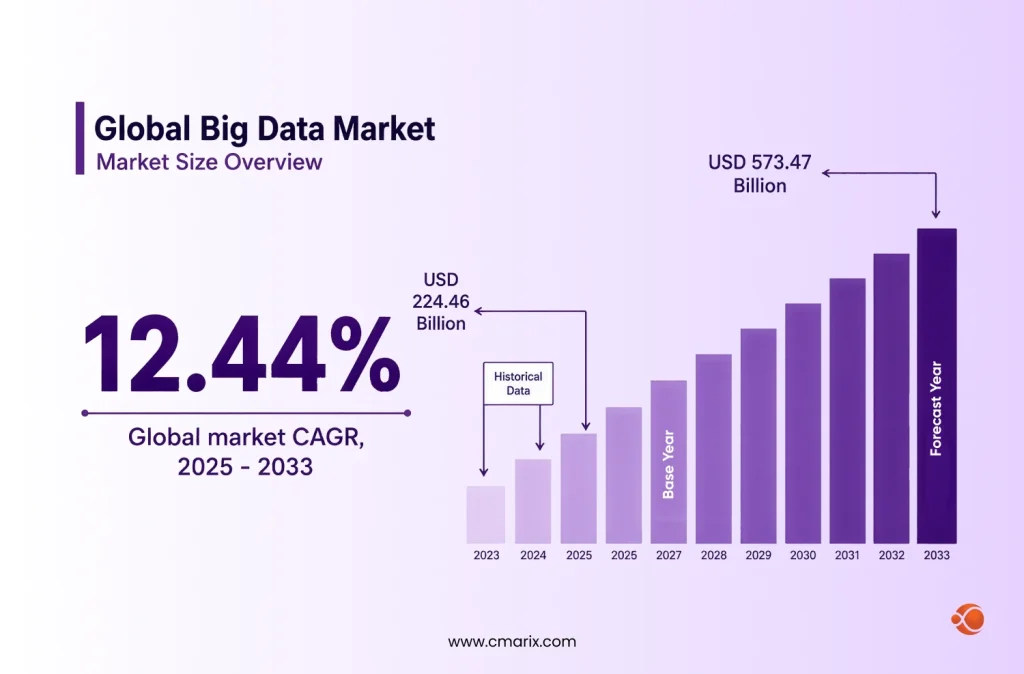
The global big data market was worth USD 199.63 billion in 2024. And it is expected to grow from USD 224.46 billion in 2025 to USD 573.47 billion in 2033, at a CAGR of 12.44% from 2025 to 2033.
What makes it different from traditional reporting is the focus on prediction, not just description. A report tells you what happened last quarter. Data science tries to tell you what’s likely to happen next quarter, and why, based on patterns hidden in the data itself.
Why Data Science Matters for Modern Businesses
The scale of data being generated right now makes this less optional than it used to be. The global volume of data generated, captured, and consumed is projected to scale exponentially, reaching close to 182 zettabytes. A big part of that surge is coming from connected devices. More than 75 billion connected IoT devices worldwide are continuously streaming raw data that needs real-time processing. That’s not a future problem. That’s already happening, and it’s only accelerating.
Businesses that treat this data as an asset, rather than a byproduct, end up making faster and more accurate decisions in a few key areas:
- Demand forecasting – predicting what customers will want before they ask for it
- Risk detection – flagging fraud, defaults, or any operational failures early
- Personalization – tailoring offers and content at an individual level instead of broad segments
- Process automation – removing manual steps in workflows that used to require constant human review
- Resource planning – allocating budget, staff, and inventory based on predicted demand rather than guesswork
This shift is part of a much bigger pattern. Data and AI are redefining business success across nearly every sector, not because the technology is new, but because the cost of ignoring it keeps going up. Companies going through digital transformation for businesses almost always have data science sitting somewhere near the core of that shift, since better decisions ultimately depend on better data.
Our team can map out a practical starting point based on your current data setup.
Data Science Life Cycle: 6 Steps of the Data Science Process
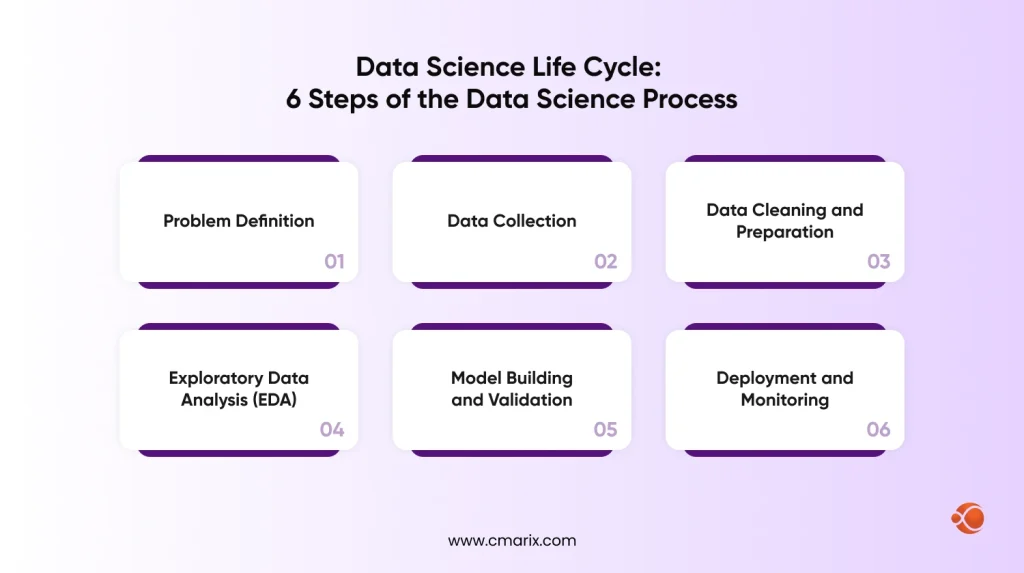
Every data science project, no matter the industry, follows roughly the same sequence. Skipping steps is usually why projects fail or produce unreliable results.
| Step | Primary Goal | Common Tools |
| Problem Definition | Define the business problem and success metrics | Stakeholder interviews, KPIs, business requirement documents |
| Data Collection | Gather data from relevant sources | SQL, APIs, web scraping tools, data warehouses |
| Data Cleaning | Prepare and standardize data for analysis | Python (Pandas), OpenRefine, NumPy |
| Exploratory Data Analysis (EDA) | Identify trends, patterns, and anomalies | Matplotlib, Seaborn, Tableau, Power BI |
| Feature Engineering | Create and refine variables for better model performance | Pandas, Featuretools, Scikit-learn |
| Model Building | Train and evaluate predictive models | Scikit-learn, TensorFlow, PyTorch, XGBoost |
| Model Validation | Test the accuracy and reliability of models | Cross-validation, ROC-AUC, Precision-Recall metrics |
| Deployment | Deploy models into production environments | Docker, MLflow, Kubernetes, cloud platforms |
| Monitoring & Maintenance | Track performance and update models as needed | MLflow, Prometheus, Grafana, cloud monitoring tools |
Step 1: Problem Definition
In order to analyze data, one first needs to formulate an appropriate question. “Increase sales” does not provide sufficient information. “Product that customers will discontinue their subscription within thirty days” would be an example of a proper question. This step also involves agreeing on what success looks like before any code is written.
Step 2: Data Collection
This is where you gather the raw material, pulling from databases, APIs, sensors, logs, or third-party sources. For larger organizations dealing with data spread across multiple teams and systems, Data Mesh Architecture is worth understanding here, since fragmented data sources are one of the biggest blockers at this stage.
Step 3: Data Cleaning and Preparation
Raw data is almost never ready to use. This step includes handling missing values, removing duplicates, converting data into a usable structure, and fixing inconsistent formatting. Most data scientists will tell you this step eats up more time than any other, often more than all the other steps combined.
Step 4: Exploratory Data Analysis (EDA)
Here, you look for correlations, patterns, and anomalies before developing any model. Visualization, summary statistics, and basic hypothesis testing all happen at this stage. It’s where you start forming a hunch about what the data is actually telling you, and where bad assumptions usually get caught before they become bigger problems.
Step 5: Model Building and Validation
This is the step most people picture when they think of data science. You select an algorithm, train it on your data, and test how well it performs on data it hasn’t seen before. If the model performs well only on training data, it’s likely overfit and won’t hold up in the real world once deployed.
Step 6: Deployment and Monitoring
A model that sits in a notebook is not doing anyone any good. Deployment puts it into production, where it can actually influence decisions, and monitoring keeps track of how it performs over time, since data patterns shift and models can degrade. Teams managing this stage often run into questions around DataOps vs. DevOps, since deploying and maintaining data pipelines requires a different operational rhythm than standard software deployment.
This entire sequence is often called the machine learning workflow when the end goal is a predictive model, though the same steps apply even to simpler statistical analysis.
Essential Data Science Skills for Beginners and Professionals
If you’re mapping out a data science roadmap for beginners, these are the skills that show up in nearly every job posting and every successful project:
- Statistics and Probability – the foundation for understanding distributions, correlation, hypothesis testing, and whether a result is actually meaningful or just noise in the data.
- Programming (Python and R) – Python data science libraries like Pandas, NumPy, and Scikit-learn dominate the field, with R remaining popular in academic and statistical research settings.
- Data Visualization – the ability to turn numbers into charts and dashboards that non-technical stakeholders can actually understand and act on without needing a stats background.
- Machine Learning Fundamentals – knowing when to use regression, classification, clustering, or other approaches, and understanding the tradeoffs between accuracy, speed, and interpretability.
- Business Acumen – the skill that separates a good data scientist from a great one. Without it, technically sound models end up answering questions nobody actually asked.
- Communication – translating technical findings into plain language that drives action, not just a report that sits unread in someone’s inbox.

Top Data Science Tools and Technologies in 2026
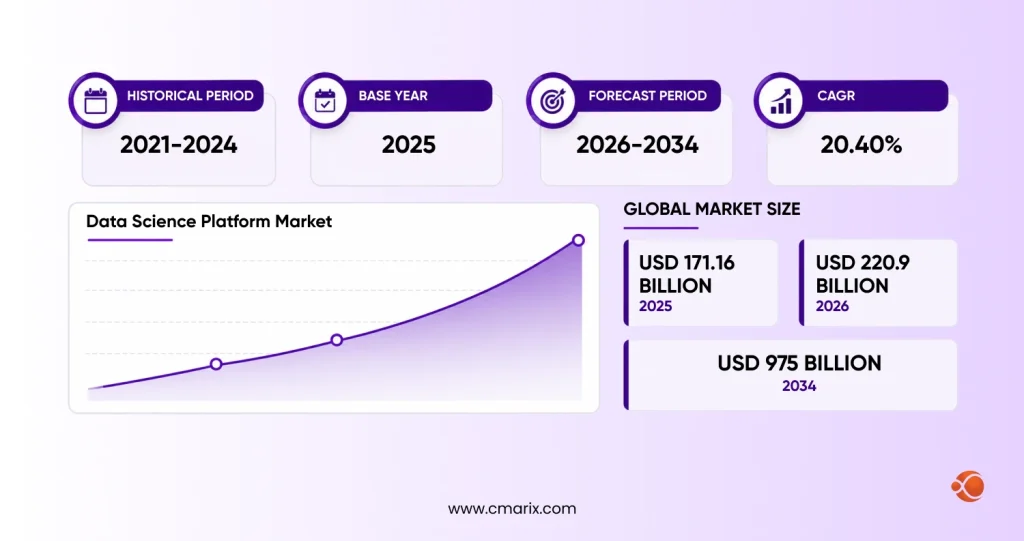
The tooling landscape has consolidated quite a bit. The global data science platform market is surging from around USD 220.9 billion in 2026 to USD 975 billion by 2034, largely because companies want fewer, more integrated platforms instead of a patchwork of disconnected tools that don’t talk to each other.
- Programming Languages – Python is still the language of choice because of its readability and extensive data science libraries, whereas SQL is still an essential requirement when dealing with structured data.
- Visualization Tools – Tableau and Power BI lead for business dashboards, giving non-technical teams a way to interact with data without writing a single line of code.
- Notebooks and Development Environments – Jupyter Notebooks remain the standard for exploratory analysis, letting data scientists mix code, output, and notes in one continuous, shareable document.
- Cloud Platforms – AWS, Azure, and Google Cloud provide the infrastructure for storage, compute, and increasingly, pre-built machine learning services that reduce the need to build models from scratch.
- Open-Source Frameworks – if you’re choosing a stack from scratch, it’s worth comparing the best open-source data science frameworks before committing, since the right framework choice early on saves a lot of rework later down the line.
One decision that comes up constantly, especially for companies working with sensitive data, is private vs. public AI Models, and which one actually fits their compliance and data security needs without slowing down development.
We help teams pick tools that actually fit their data maturity level.
Data Science vs Data Analytics vs Machine Learning: What’s the Difference
These three terms get used interchangeably way too often, and that confusion causes real problems when hiring or scoping a project.
| Aspect | Data Analytics | Data Science | Machine Learning |
| Focus | Interpreting past data | Building predictive systems | Algorithms that learn from data |
| Output | Reports, dashboards | Models, forecasts | Trained models, automated decisions |
| Skill Level | SQL, Excel, BI tools | Statistics, coding, ML, business sense | Deep ML and mathematics expertise |
| Question Answered | “What happened?” | “What will happen, and why?” | “Can a system learn to predict this on its own?” |
In short, analytics looks backward, data science looks forward, and machine learning is one of the tools data science uses to get there. None of these exists in isolation, and most real projects blend all three depending on the stage of the work. A growing piece of this puzzle now includes generative AI in data science applications, which is changing how quickly models can be built, tested, and deployed across all three categories.
Real-World Data Science Applications Across Industries
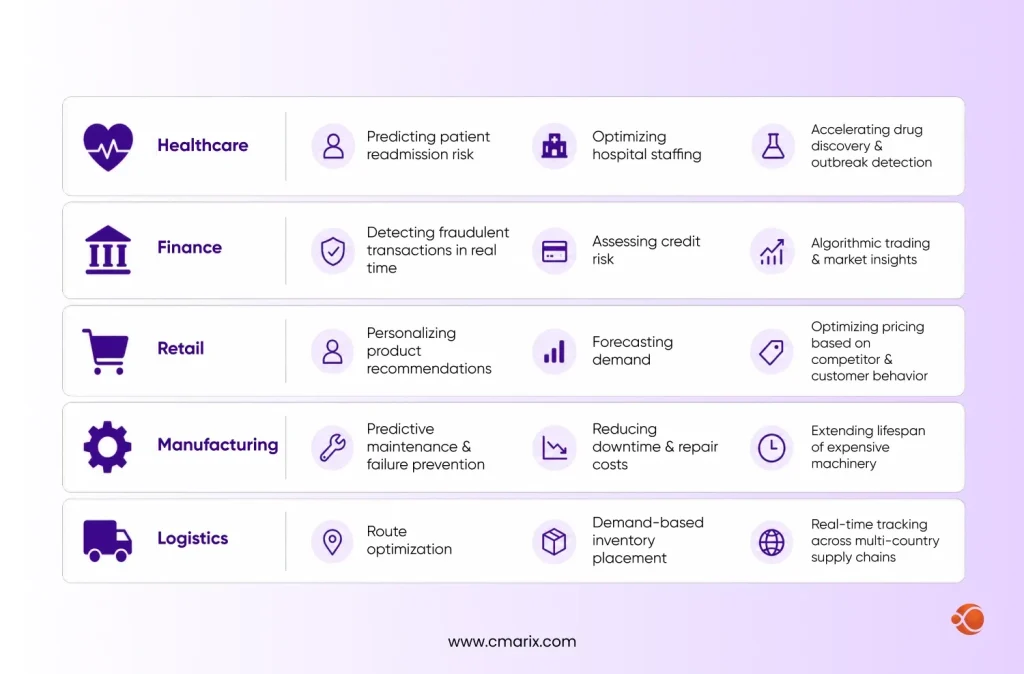
Data science doesn’t live in one industry. It shows up wherever there’s enough data to learn from, and the use cases keep expanding every year.
- Healthcare – predicting patient readmission risk, optimizing hospital staffing, and accelerating drug discovery through pattern recognition in clinical trial data. Hospitals also use it to flag early signs of disease outbreaks.
- Finance – detecting fraudulent transactions in real time, assessing credit risk, and powering algorithmic trading strategies that react to market shifts faster than any human could.
- Retail – personalizing product recommendations, forecasting demand, and optimizing pricing based on competitor and customer behavior across thousands of products simultaneously.
- Manufacturing – predictive maintenance that flags equipment failures before they happen, reducing downtime and repair costs while extending the lifespan of expensive machinery.
- Logistics – route optimization, demand-based inventory placement, and real-time tracking across supply chains that span multiple countries and carriers.
Each of these depends on solid data engineering underneath, which is why so many organizations end up needing to hire data engineers before any of the analytics or modeling work can even start moving forward.
How to Build a Data Science Team: Roles, Skills, and Structure
If you’re past the “should we invest in data science” question and into “how do we actually staff this,” here’s what a functional team typically looks like:
- Data Engineer: Designs, builds, and maintains the data infrastructure that collects, processes, and stores data from multiple sources. They ensure data is accurate, accessible, and ready for analysis.
- Data Analyst: Focuses on reporting, dashboards, and business intelligence. Data analysts help stakeholders understand historical performance, identify trends, and make data-driven decisions.
- Data Scientist: Applies statistical methods, predictive modeling, and machine learning techniques to solve complex business problems, uncover patterns, and generate forecasts.
- Machine Learning Engineer: Bridges the gap between data science and software engineering by deploying, monitoring, and scaling machine learning models in production environments.
Key Skills Across the Team
- Data management and ETL development
- Machine learning and predictive modeling
- Business intelligence(BI) and data visualization
- Programming languages: Python, R, and SQL
- Communication and stakeholder collaboration
- Cloud platforms and big data technologies
- Experimentation and statistical analysis
Building this in-house sounds straightforward until you actually try it. Hiring even one strong data engineer can take months, and a complete team needs all four roles working in sync, which usually means six figures in salary before any project even ships. Most mid-sized companies don’t have the volume of ongoing work to justify four or five full-time hires, and the skills shortage in this space makes hiring competitive even when budget isn’t the issue.
There’s also the question of retention. Skilled data professionals are in high demand, and losing one mid-project can stall progress for weeks while you search for a replacement. This is exactly the kind of hassle that pushes companies toward outsourcing this work to a team that already has the structure in place.
Why CMARIX Is the Right Data Science Partner for Your Business
CMARIX brings together data engineering, DevOps consulting services, and AI-driven custom software solutions under one roof, so you’re not stitching together three different vendors to get a working data pipeline. Our engineering team has built real-world data science systems across retail, fintech, and logistics, with the same lifecycle discipline covered earlier in this guide: clear problem framing, clean data pipelines, validated models, and deployment that’s actually monitored, not just shipped and forgotten.
Whether you need a single data engineer to fix a broken pipeline or a full team to build a forecasting system from scratch, you get people who’ve done this before, without the months-long hiring cycle or the uncertainty of building a team from zero.
Conclusion
Data science is not a single skill or a single tool. It’s a process that turns scattered, messy data into decisions a business can actually act on. Understanding the lifecycle, the right tools, and the skills involved provides you with a real starting point, whether you’re learning this yourself or trying to figure out how to staff it.
And if building that team in-house feels like more friction than it’s worth, that’s a completely normal conclusion to reach, and one a lot of companies land on after weighing the actual cost.
FAQs About Data Science
What exactly does a Data Scientist do?
A data scientist collects, cleans, and analyzes data to develop predictive models and uncover patterns that guide business decisions. They work across statistics, programming, and domain knowledge to turn raw, messy data into insights that teams can confidently act on day-to-day.
What foundational skills and tools do I need to learn?
Start with statistics, SQL, and Python because they make up the core of almost all data science jobs. After that, progress to data visualization software such as Tableau, and after you get used to everything, learn machine learning algorithms such as Scikit-learn.
What is the Data Science lifecycle?
It’s the six-step process covering problem definition, data collection, cleaning, exploratory analysis, model building, and deployment. Each step builds directly on the last, and skipping any of them usually leads to unreliable models or results nobody can fully trust.
Is the field of data science hard to learn?
It has a real learning curve because it blends statistics, coding, and business thinking into one discipline. That said, it’s approachable if you build skills incrementally, focusing on one area at a time instead of trying to master everything at once.
What is the “80/20 rule” in data science?
This term refers to the well-known fact that about 80% of the effort goes into data collection and processing, and 20% into modeling. This ratio shocks many newcomers who expect modeling to be dominant in the process.
What is the core lifecycle of a data science project?
It mirrors the 6-step process: defining the problem, gathering data, cleaning it, exploring patterns, developing and validating a model, and then deploying and monitoring it. Each phase involves validating a model, then deploying and monitoring it. Each phase feeds directly into the next, with no real shortcuts available.