Key Highlights
- Tracking AWS CI/CD pipeline metrics provides teams with objective data to improve software quality and delivery speed.
- The DORA metrics have a one-to-one correspondence with the AWS products, which means that you can compare your DevOps practices to industry benchmarks easily.
- Amazon Athena, AWS CloudWatch, CodePipeline, and QuickSight act as the layers in an analytical solution, covering everything from data ingestion to visualization.
- Automation of data collection by utilizing Lambda and Step Functions saves a lot of time for reporting and ensures up-to-date results.
- The flakiness rates, test coverage, and failure trends are as crucial as speed to deployment since ignoring them means losing sight of key aspects of pipeline health.
- Companies that enable developers to make metrics visible throughout the organization can move fast and break much less.
Most engineering teams know their CI/CD pipeline is important. What few teams know is exactly what’s happening inside it on any given day. How long does a code change take to reach production? When a deployment fails, what percentage of builds are broken by flaky tests versus real defects? How fast does the team ask rhetorical questions? These are the differences between a high-performing team and one that’s constantly fighting fires.
So, the thing is AWS provides you with every tool you need to answer them. The problem isn’t capability. It’s the connection of dots between their CI/CD pipeline activity and a real-time analytics layer that surfaces those answers automatically.
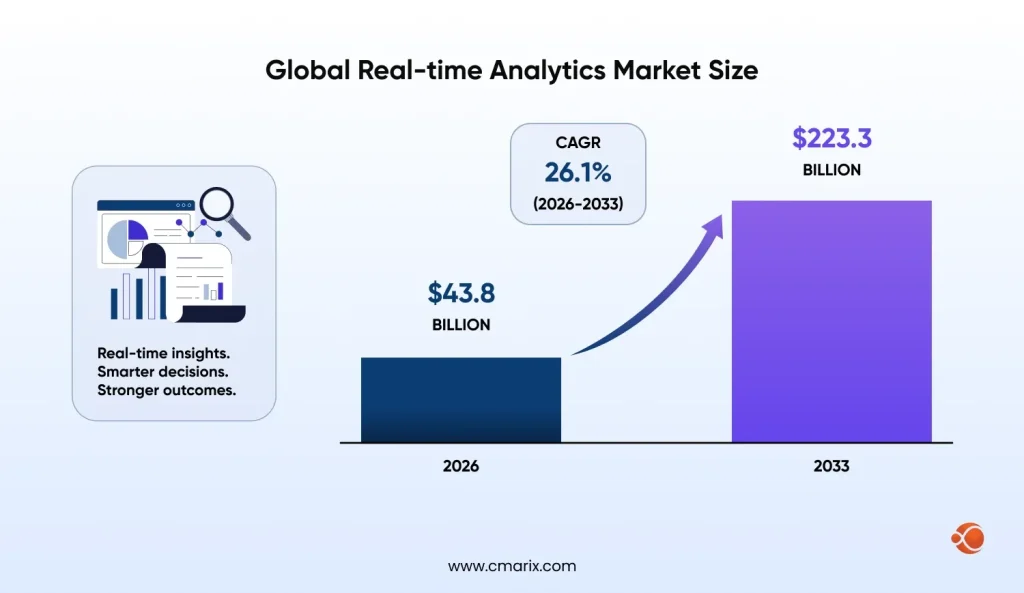
As per Persistence Market Research, the global real-time analytics market size is expected to reach $43.8 billion by 2026 and $223.3 billion by 2033. There cannot be any doubt about the importance of instant insights; rather, it is the baseline requirement. And your DevOps pipeline should also fall under the same umbrella.
The Strategic Role of Metrics in AWS CI/CD Pipelines
Why Metrics Matter More Than Gut Instinct
Engineering teams are good at intuition. After enough sprints, you develop a feel for which parts of the pipeline tend to break, which deployments are risky, and which tests are probably lying to you. That intuition has real value.
But it doesn’t scale and doesn’t hold up in a post-incident review. When a pipeline slows down or requires someone with institutional memory to reconstruct a sequence of events from logs, half-remembered standup notes, and Slack messages. But this approach does not scale, nor will it survive an after-the-fact analysis. When using metrics, you get a timeline; you get baselines; and you get the data that explains not only what happened but also whether it was a one-off incident or a trend.
Metrics change the way teams think about decisions, too. With the frequency of deployments being measured, making them lower is something tangible rather than a vague notion. If you measure the lead time, the bottlenecks become apparent, and addressing them yields tangible results. This is what differentiates an engineering culture driven by metrics from an approach based on luck and intuition. And it’s one of the clearest benefits of cloud computing for business: the infrastructure doesn’t just run your software; it tells you how that software is actually performing.
What the Industry Data Actually Shows About Pipeline Monitoring
The case for pipeline monitoring isn’t just theoretical.
Below is what the research tells us:
- IEEE/ISO/IEC 32675 gives the international standard framework for DevOps processes, explicitly finding continuous monitoring and measurement as requirements for mature delivery pipelines, not optional improvements.
- NIST SP 800-204 verifies that instrumented pipelines with sufficient observability controls meet operational standards and federal security guidelines, making it a compliance issue instead of just an engineering one.
- Teams that consistently measure DORA metrics (more on those below) are 2x more likely to exceed their organizational performance goals compared to teams that don’t, according to industry research from Google’s DevOps Research and Assessment program.
- Real-time DevOps analytics enables teams to catch deployment regressions within minutes rather than hours, the difference between a quick fix and a customer-facing incident.
Stat worth noting: The global real-time analytics market is growing at a compound rate that reflects a simple reality: organizations that can act on live operational data outperform those that can’t. Your CI/CD pipeline generates that data every time a commit is pushed.
Most teams don’t know what’s slowing their deployments until it’s already costing them.
Essential AWS CI/CD Metrics Every DevOps Team Should Track
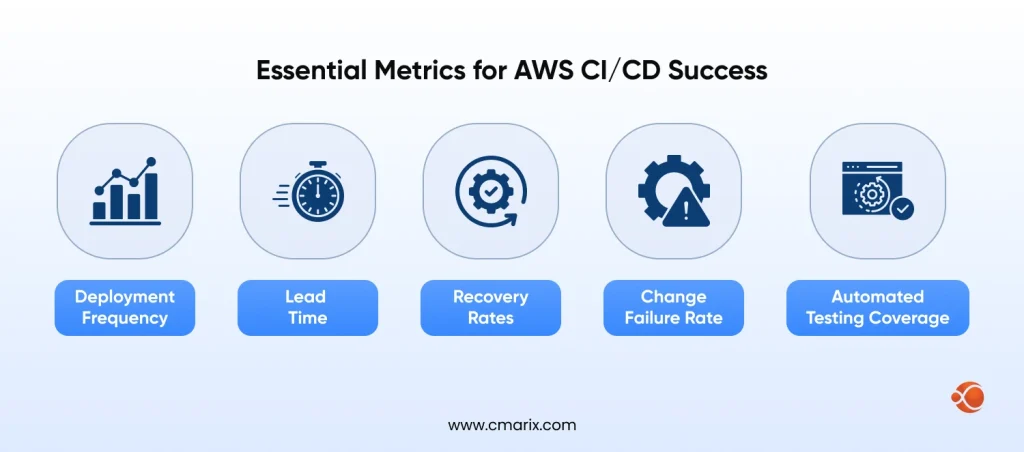
Deployment Frequency, Lead Time, and Recovery Rates
| Metric | What It Measures | Healthy Benchmark |
| Deployment Frequency | How often is code successfully released to production | Daily to multiple deployments per day for elite-performing teams |
| Lead Time for Changes | Time taken from code commit to production deployment | Less than 1 hour for elite teams; less than 1 day for high performers |
| Mean Time to Recovery (MTTR) | The speed at which service is restored after an incident or failure | Less than 1 hour for elite-performing organizations |
| Pipeline Execution Time | Total duration required for a complete CI/CD pipeline run | Typically under 10 minutes for efficient pipelines |
| Queue Wait Time | Time builds remain queued before execution begins | Ideally, near zero; longer waits usually indicate infrastructure or resource bottlenecks |
Change Failure Rate and Automated Testing Coverage
| Metric | What It Measures | Healthy Benchmark |
| Change Failure Rate | Percentage of deployments that introduce production issues or require remediation | 0–15% for elite to high-performing engineering teams |
| Automated Test Coverage | Portion of the codebase validated through automated testing | 80%+ overall coverage; 100% coverage for critical business and security paths |
| Test Pass Rate | Percentage of automated test executions that complete successfully | 95%+ in a stable and reliable CI pipeline |
| Flaky Test Rate | Tests that fail inconsistently without corresponding code changes | Below 2%; anything above 5% often signals deeper reliability issues |
| Build Success Rate | Percentage of CI builds succeeding without manual fixes or retries | 90%+ in a properly maintained CI/CD environment |
How These Metrics Work Together as a System
No single metric tells the whole story. That’s worth saying clearly, because teams often start tracking one number and mistake it for a complete picture.
The relationships between these metrics are as follows: the frequency of deployments without considering lead time does not provide accurate information about your processes. You may deploy software frequently; however, if the lead time for each deployment is 3 days, then it is an illusory number. The lead time is a more accurate indicator of how fast you deliver value to customers.
‘Change failure rate’ and ‘recovery rate’ metrics are a pair. If you deploy frequently and have a 25% change failure, then you generate more incidents than you resolve. However, having a high failure rate and slow recovery times means that when your incidents occur, they affect you significantly. You want to move both indicators in the correct direction.
Test coverage and pipeline health indicators go hand in hand. Low automated test coverage will increase your chance of failure, while bugs are detected in the production environment rather than in CI. Flaky tests will decrease your build success rate artificially, which means that you cannot rely on those metrics since there is too much noise. Fixing flakiness is essential since it will improve all the other metrics.
How DORA Metrics Improve AWS DevOps Performance
Mapping DORA Metrics to AWS DevOps Processes
| DORA Metric | AWS Equivalent Service or Tool | What to Track |
| Deployment Frequency | Amazon Web Services CodePipeline | Number of successful pipeline executions per day or week using CloudWatch metrics |
| Lead Time for Changes | Amazon Web Services CodeCommit + CodePipeline | Time difference between code commit and successful production deployment |
| Change Failure Rate | Amazon Web Services CodeDeploy + CloudWatch Alarms | Ratio of failed deployments to total deployment events |
| Mean Time to Recovery (MTTR) | Amazon Web Services CodeDeploy rollback events + CloudWatch | Duration between failure alert detection and the next successful deployment or rollback completion |
AWS CloudWatch for Real-Time Pipeline Monitoring
CloudWatch is your primary real-time observability layer. It captures pipeline events and builds execution data and deployment results as they happen, and lets you define alarms that fire the moment something crosses a threshold you care about.
What makes CloudWatch particularly well-suited for automated pipeline monitoring is its native integration with CodePipeline, CodeBuild, and CodeDeploy, meaning you don’t have to instrument anything manually to start capturing execution data. The events flow in automatically.
Key things to monitor in CloudWatch for your CI/CD pipeline:
- Pipeline execution states events: captures start, failure, success, and cancellation events per stage
- CodeBuild build time metrics: monitors the time spent in each stage of development, useful for identifying any performance degradation during test suite runs
- Deployment success and failure rates: tie directly to your change failure rate calculation
- Custom metrics via CloudWatch Embedded Metric Format: lets you push application-level metrics from your pipeline scripts into the same dashboard
AWS CodePipeline Metric Dashboards
CodePipeline gives built-in execution history and per-stage success rates that integrate directly with CloudWatch dashboards. The native dashboards are a strong starting point for teams just beginning to track pipeline health. For teams that want more from their AWS CodePipeline visualization, this is where a DevOps consulting services provider can help bridge the gap between what’s built in and what the business actually needs.
Metrics to be identified in your CodePipeline dashboard:
- Stage transition success rate: Identifying which particular stages (source, build, test, deploy) experience failures the most often.
- Execution time trend: Helps determine whether pipelines are slowing down over time, which means that test suites have grown but haven’t been optimized.
- Failures of execution: Differentiating whether a pipeline execution is manually triggered or automated helps determine failure patterns.
- Number of concurrent executions: Helpful during the high-load feature development period.
How to choose between Native AWS and Third Party Tools?
| Criteria | Native AWS (CloudWatch, CodePipeline) | Third-Party (Datadog, Grafana, New Relic) |
| Setup Time | Fast — no additional integration needed for CodePipeline and CodeBuild | Requires agent installation, API setup, and service integrations |
| Cost | Included within the AWS ecosystem pricing, CloudWatch metric charges may apply | Additional licensing costs based on users, hosts, or data ingestion |
| Data Retention | CloudWatch supports up to 15 months by default; longer retention is possible with S3 and Athena | Retention varies by provider, commonly 13–26 months on standard plans |
| Visualization Quality | Good for operational monitoring; BI-level dashboards may require QuickSight | Typically offers richer dashboards, visualizations, and alerting interfaces out of the box |
| Cross-Service Correlation | Native integration across AWS services using shared metrics and event systems | Requires separate integrations or exported telemetry from each service |
| Custom Metric Flexibility | Strong support through Embedded Metric Format and custom namespaces | Also highly flexible, though custom metric ingestion can increase costs |
| Best For | Organizations operating fully on AWS with minimal monitoring overhead | Teams using multi-cloud or hybrid environments, or needing advanced observability and alerting features |
Automating CI/CD Metrics Collection with AWS Lambda and Step Functions
Athena and Amazon QuickSight for Data Visualization
This is where AWS CI/CD pipeline metrics go from raw numbers to actual insights. Amazon Athena lets you run SQL queries directly against your CloudWatch logs and CodePipeline execution history stored in S3, no database infrastructure required. It’s a serverless data warehouse in practice, which means you query what you need, when you need it, without managing clusters.
The union of Amazon QuickSight and Athena leads to the formation of what AWS terms a BI-as-Code model, in which the dashboards as well as datasets are deployed and version-controlled just like the application codes themselves. This technique has been officially highlighted by AWS in their company blog, and this is arguably one of the best practices for those who take operationalizing metrics seriously. If you’re new to the tool, understanding the full benefits of Amazon QuickSight before you begin building will save you from architecting around limitations that don’t actually exist.
CodePipeline and CloudWatch export their execution data to Amazon S3 through Kinesis Firehose or scheduled exports. Athena resides on top of this S3 data layer, providing you with a querying layer. QuickSight pulls data from Athena as a data source and refreshes your dashboards as soon as more data flows into your pipelines. This gives you an instantaneous DevOps dashboard without any data transfer overhead.
If your team is already using QuickSight for business intelligence, working with experienced AWS QuickSight developers can accelerate the dashboard build significantly, especially when correlating pipeline metrics with business outcome data.
Lambda and Step Functions for Automated Metric Collection
It’s the collection layer where teams tend to be lazy and then complain about the lack of real-time visibility in dashboards. Step functions and Lambda are perfect solutions here.
Here’s the architecture:
- Lambda functions are triggered by CodePipeline state changes notifications using EventBridge and collect execution metadata, storing it in S3 in a form that can be easily queried by Athena
- Step Functions control complex multi-step processes in collecting metrics, such as running calculations of MTTR after successful deployment, or finding out which particular test failed in case of build failures
- No polling needed, just use EventBridge rules to correlate pipeline events with Lambda triggers
Key implementation points:
- Use Athena’s partition pruning using the date-based S3 prefixes (yyyy/mm/dd)
- Keep raw data and metrics apart, so that you can reprocess derived metrics in case of a change in your metric calculation logic
- Create dead-letter queues for Lambda, to make sure that metric failures are not silently ignored
- Use Lambda environment variables to parameterize pipeline names and stage configurations, making the collection layer reusable across multiple pipelines
Building a Self-Updating Metrics Pipeline
A properly engineered metrics pipeline must not need any manual intervention after it has been deployed. Here is what happens:
- EventBridge collects pipeline events: All CodePipeline execution status changes automatically generate rules
- Lambda parses and enriches the event: Adds custom fields such as duration, success/failed flag, and the pipeline stage name
- Raw JSON stored in S3: Partitioned by date to facilitate efficient Athena queries
- Glue crawler updates Athena table: Happens on a daily or hourly basis, registering newly discovered S3 partitions to Athena
- Athena view computes DORA metrics: Pre-computed SQL views calculate deployment frequency, lead time, and change failure rate
- Quicksight SPICE gets updated on schedule: Pulls newly computed Athena query results and updates its dashboards accordingly
- CloudWatch alarms look for outliers: Send out alerts via SNS if metrics go beyond acceptable limits
This architecture is a practical example of Advanced AWS Integration, multiple services working together across event, storage, compute, and visualization layers without any of them needing direct coupling. The end result is a DevOps metrics dashboard that updates itself, alerts on its own, and gives every stakeholder a single source of truth.
Skip the trial and error — we’ve built this architecture dozens of times.
The Role of Testing Metrics in High-Performing DevOps Pipelines
Test Coverage — What Good Actually Looks Like
Coverage percentages get thrown around a lot, and they can be misleading. 80% coverage doesn’t mean the same thing in a payment service as it does in a static content renderer. Context matters.
That said, here are the benchmarks by test type that actually mean something for pipeline health:
| Test Type | Coverage Target | Notes |
| Unit Tests | 80–90% line coverage | Should validate all business logic paths, edge cases, and error conditions |
| Integration Tests | Coverage across boundaries and interfaces between key services | Prioritize API contracts, database interactions, and service communication rather than exhaustive path coverage |
| End-to-End (E2E) Tests | Critical user journeys and release-critical workflows | Focus on depth over breadth; maintain a smaller set of stable and reliable E2E tests instead of many flaky ones |
| Security Tests (SAST) | Full codebase scan on every commit | Required for production-facing pipelines to identify vulnerabilities early in the development lifecycle |
| Infrastructure Tests | All CDK, Terraform, or Infrastructure-as-Code modules | Often overlooked, but important for catching configuration drift and deployment misconfigurations before release |
Detecting and Reducing Test Flakiness
Flaky tests are a symptom of a health issue in the build process itself, rather than a testing problem in itself. Here are some ways to detect and solve flaky tests:
Symptoms:
- Tests that run successfully locally but fail consistently in CI, or vice versa
- Builds that succeed even if the exact same pipeline fails because there were no code changes made
- Large variations in execution time per test case across multiple executions
Causes:
- Tests with timed waits: Tests that rely on completion within some time period
- Tests involving state: Tests that write data into the database or cache without cleaning between test cases
- Tests with dependencies on services: Tests that communicate with external service APIs and don’t mock those, causing timeout and rate limit errors
- Tests depending on execution order: Values obtained from test cases aren’t deterministic because of the difference in the order of the test cases
Solution:
- Label any flaky tests as such and isolate these test cases during the build validation process
- Include exponential retries for integration tests interacting with external services
- Use event-based waiting via polling for any timed tests and remove timed waits
- Reset any shared state between each test case to ensure proper isolation
- Measure flakiness rates on a per-test basis and store in CloudWatch metrics
Connecting Test Metrics to Pipeline Health
The performance of tests does not occur in a vacuum and is used as the basis for each other metric of concern in your pipeline process. Having an elevated level of flakiness in testing leads to an overinflated number in your build failure rate, leading to a skewed change failure rate. It also becomes easier for engineers to disregard test failure due to flakiness.
This connection also runs the other direction. If your MTTR (Mean Time to Repair) is high, one of the first places to look is test coverage on the code path that failed. Teams that recover quickly from incidents typically have high integration test coverage on their critical paths, not because the tests prevented the failure, but because they already had the tooling to quickly identify and isolate the problem.
Best Practices for Monitoring and Reviewing CI/CD Metrics
Setting Baselines and Meaningful Thresholds
In order to set an appropriate alarm, one needs to know what normal is in relation to their pipeline. These benchmarks provide guidance as to where the discussion should start, but the baseline comes from your own numbers.
Please do not make any changes to your pipeline at all and allow it to continue running for a span of two to four weeks. Please ensure that you capture the deployment frequency, lead time, and success rate for builds as is.
Principles of threshold setting that stand the test of practice:
- The warning threshold should be set to 20% above your baseline, and the critical one, at 50%
- Avoid fixed thresholds if the metric depends on the day of the week (lower deployments happen on Friday, usually)
- Set up alerts on the rate of change rather than the value itself; a 30% increase in lead time is much more meaningful than a consistent lead time of 35 minutes lasting for months
- Check your thresholds every quarter, since pipelines are changing, stale thresholds may start to generate tons of false alarms, or may overlook real problems
Making Metrics Visible Across the Team
- Release the QuickSight dashboard on which the entire organization can access for everyone who ships code, not only the platform team
- Place a pipeline health report on your team’s Slack channel every day, including build success percentage, deployment count, and any existing alerts
- Add DORA (DevOps Research and Assessment) Metrics to your sprint retrospectives so you have real data for your velocity talks
- Make your pipeline health a “red status” visible for the entire team during an incident response, resulting in better response times
- Export weekly summaries to engineering leadership using QuickSight automated email reports, so the connection between engineering performance and product outcomes stays visible at the right level
When to Act on a Metric vs. When to Investigate First
| Signal | Likely Cause | Recommended Response |
| Single build failure on a stable pipeline | Transient flake or external dependency issue | Re-run the build and investigate further only if the failure repeats |
| Build failure rate trending up over 3+ days | Newly added test lacking isolation or a recent dependency update | Review recent commits, dependency changes, and test suite updates before taking corrective action |
| Lead time doubles overnight | New approval gate, resource contention, or pipeline misconfiguration | Check recent pipeline configuration changes and analyze build queue depth |
| Change failure rate spike after release | The recent deployment introduced a regression | Roll back the release first, then begin root-cause investigation |
| MTTR is increasing over the weeks | Incident response process weakening or alert coverage decreasing | Audit runbooks, escalation paths, and alert configurations before blaming application code |
| Test coverage drops sharply | New code merged without tests or coverage configuration changed | Review coverage reports and enforce minimum coverage thresholds in the CI/CD pipeline |
Conclusion
The gap between teams that ship confidently and teams that ship nervously typically comes down to one thing: visibility. Not talent, not team size, not tooling sophistication. Just knowing what’s actually happening in your pipeline, in real time, with enough context to act on it.
AWS provides you with everything you need to close that gap: CodePipeline for execution tracking, CloudWatch for real-time monitoring, and QuickSight for the kind of interactive dashboards that make DORA metrics meaningful to everyone, from engineers to executives.
If you’re ready to move from gut instinct to data-driven DevOps, start with your baselines. Measure what you have. Then build forward from there. Teams looking to implement enterprise DevOps at scale will find this metrics foundation pays back faster than almost any other infrastructure investment. And if you’d rather move fast with a team that’s done this before, CMARIX’s dedicated AWS developers can take the build off your plate entirely.
FAQs on AWS CI/CD Pipeline Metrics
How does Amazon QuickSight integrate with AWS CodePipeline?
Not directly, CodePipeline events flow into CloudWatch, get exported to Athena, and S3 queries that data. QuickSight then connects to Athena as its data source, providing you with a fully serverless analytics stack with no database to manage.
What are the benefits of a data-driven DevOps approach?
Regressions are identified even before they can occur, opinions are not used to deploy code, incident analysis looks for trends rather than trying to place blame, and instrumented pipelines turn operations data into insights.
Why should I use Amazon QuickSight instead of standard CloudWatch dashboards for DevOps?
CloudWatch is developed for real-time alerting. QuickSight is developed for trend analysis, executive reporting, and historical querying. If you need to answer “Is our pipeline getting slower over time?” or track 90-day DORA trends, QuickSight via Athena is the right tool for that job.
Which DevOps metrics are most important to visualize in QuickSight?
The six basic metrics include Deployment frequency, Change failure rate, and Lead time. After setting your baseline using these metrics, go for Build Success Rate and Test Coverage metrics. These six metrics will cover everything you need from a team.
How do I get CI/CD data into QuickSight for real-time analysis?
Pipeline Events recorded in EventBridge → Lambda publishes JSON format data into S3 → Glue Crawler updates Athena metadata → Queries executed in QuickSight against Athena based on refresh schedule. For latency under 15 minutes, use the QuickSight Direct Query option instead of SPICE.
Can I automate the deployment of QuickSight dashboards as part of my DevOps pipeline?
Yes, version-control your dashboard definitions as JSON and deploy them via CodePipeline using Lambda calls to the QuickSight API. Rollbacks work the same way they do for application code; it’s the same DevOps discipline applied to your analytics layer.