

Quick Summary: Angular performance optimization comes down to shipping less JavaScript, loading it later and rendering only what changed. This guide includes 15 techniques across the build, load, rendering and measurement layers, and a practical bundle budget along with a table of legacy flags you can delete. Additionally, it talks about Angular SSR for crawlers and regression detection tools.
Angular app slowdowns don’t happen because of the framework itself very often. Instead, they occur due to the fact that bundles increase with each release, all routes are loaded at launch time, and change detection happens way too many times. For developers who deliver custom web applications with Angular, it means worse Core Web Vitals and conversions and tickets for frozen screens.
The majority of information you’ll find about Angular 2-8 is now outdated and relies on concepts such as the –prod flag and tools such as UglifyJS. Modern Angular optimization is all about signals, deferred rendering, hydration, and budget. Let’s dig into the layers of it.
This guide assumes a recent Angular release. Control flow and @defer went stable in v18, event replay in v19, and incremental hydration and the zoneless API in v20. Check the changelog for your exact version before you apply anything, since defaults keep moving
What Is Angular Performance Optimization?
Angular performance optimization is the practice of speeding up first and route loads, shrinking bundles, and cutting needless rendering work so an application stays fast as it grows. It covers build configuration, change detection, loading strategy, server rendering and continuous measurement. Think of Angular performance tuning as a habit built into the pipeline, not a one time cleanup sprint.
Understanding where problems can occur in Angular applications is essential before beginning to fix any problems:
- Oversized initial bundle: one large main file blocks first paint on slower devices.
- Eager loading: every route and heavy component is loaded before the user even needs it.
- Excess change detection: components check too frequently even if the data didn’t change.
- Heavy assets and scripts: unoptimized images and third party libraries inflate load time.
- No measurement: regression is shipped because there’s no budget or Core Web Vitals tracking.
Staying updated with the latest Angular version also matters, because many of the gains below arrive as defaults in newer releases.
How to Optimize Angular App Performance in 15 Steps
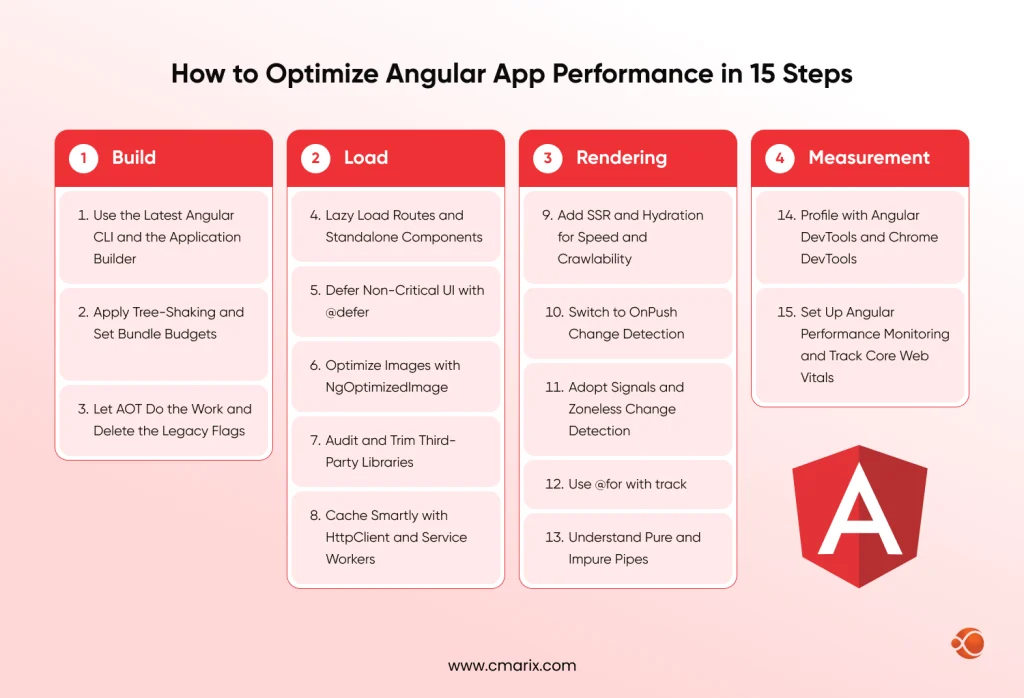
These Angular performance best practices are grouped by layer, so you can tackle the biggest bottleneck first. Together, they show how to improve the performance of Angular application codebases without a rewrite.
Layer 1: Build
1. Use the Latest Angular CLI and the Application Builder
Angular CLI sets the baseline for every build. New projects use the esbuild-based application builder, which gives noticeably faster builds and well-optimized output. Regular updates to the Angular CLI provide access to bug-fixing techniques and security feature upgrades. If your project still runs on the older webpack browser builder, the use-application-builder migration through ng update is one of the cheapest wins available.
2. Apply Tree-Shaking and Set Bundle Budgets
Tree-shaking helps in reducing build sizes by getting rid of unnecessary code. If you are using Angular CLI, it is enabled by default. Tree shaking in Angular works best with modern ES module libraries, so check that your dependencies ship that format and import only what you use, not whole packages for one helper.
Set initial bundle budgets based on your application’s requirements and measured performance. For example, you could start with a 250 KB warning threshold and a 500 KB error threshold, then adjust them as you assess real-user performance, device constraints, and application complexity. Treat these values as starting points, not universal targets. The Angular build documentation explains how size budgets work.
Here is a production configuration that keeps Angular.json optimization on and enforces limits:
"configurations": {
"production": {
"optimization": true,
"outputHashing": "all",
"sourceMap": false,
"budgets": [
{ "type": "initial", "maximumWarning": "250kB", "maximumError": "500kB" }
]
}
}
3. Let AOT Do the Work and Delete the Legacy Flags
Older Angular guides often recommend flags and build tools such as –prod, UglifyJS, and manual vendor chunk configuration. Modern Angular CLI builds handle many optimization tasks automatically, including Ahead-of-Time (AOT) compilation and minification in production configurations. However, the available flags and defaults vary by Angular version and build configuration. Check your project’s angular.json settings and verify which legacy options are still supported before removing them.
| Old advice | Modern Angular |
| JIT compilation in the browser | AOT is the default build mode |
| –prod and –aot flags | Production configuration is the default for ng build |
| UglifyJS and the build optimizer flag | Minification is built into the builder |
| vendor-chunk and manual chunk tweaks | The builder splits chunks automatically at dynamic imports |
| Calling the CLI output files asynchronously by hand | Lazy routes and @defer handle splitting |
| .htaccess modules for compression and caching | Compression and cache headers set at the CDN or web server |
Gzip and Brotli compression, together with long-lived caching for fingerprinted assets, remain useful. Configure these at the server or CDN level and verify that the deployed application serves them correctly.
Layer 2: Load
4. Lazy Load Routes and Standalone Components
In Angular, lazy loading means a route’s code downloads only when someone visits it. With standalone components, you can lazy load a single component with loadComponent, or a whole feature with loadChildren, with no NgModule required.
export const routes: Routes = [
  { path: 'dashboard', loadComponent: () => import('./dashboard/dashboard.component').then(m => m.DashboardComponent) },
  { path: 'admin', loadChildren: () => import('./admin/admin.routes').then(m => m.ADMIN_ROUTES) }
];
Dynamic imports provide code-splitting points, allowing the build system to create separate chunks where appropriate. Inspect the production build to confirm that large features are excluded from the initial bundle. Choose a route-preloading strategy based on navigation patterns, network conditions, and the size of deferred features. PreloadAllModules can make subsequent navigation faster, but it may also increase bandwidth usage and compete with other resources.
Large products can go further and split by team and domain. Our guide to Angular in micro frontend architecture shows when that extra structure pays off.
5. Defer Non-Critical UI with @defer
Everything that appears on a page may not be required for initial painting. The @defer tag defers heavy components like graphs, comments, and maps until a trigger is fired.
@defer (on viewport) {
  <app-sales-chart />
} @placeholder {
  <div class="chart-skeleton"></div>
}
Triggers include on viewport, on idle, on interaction, on hover, and on timer, and you can prefetch the code earlier than it renders. Do not defer anything above the fold, since that can hurt Largest Contentful Paint.

6. Optimize Images with NgOptimizedImage
Large image files can increase page weight and delay rendering, the more likely it is to have an effect on performance optimization and load time. Applications work better and function well if images or other materials are small in size.
The NgOptimizedImage helps form good practices through its width and height attributes for avoiding layout shifts, defaults to lazy loading, and gives the opportunity to mark the hero image with the priority attribute to prioritize fetching. Combine it with images in WebP and AVIF formats and compress the source using services such as Compressor.io and TinyPNG.
7. Audit and Trim Third-Party Libraries
Every library improves the program, yet occasionally it can have a detrimental effect on performance. Also, every library makes files larger and takes longer to load.
Audit what you ship. Use the command ng build –stats-json and analyze the file using the esbuild bundle analyzer to determine which libraries are the largest. Swap out these bulky libraries for smaller ones.
8. Cache Smartly with HttpClient and Service Workers
Caching is another effective method for improving Angular performance optimization and speeding up loading time. Caching of data can help you to reduce the time taken to load applications and minimize the number of HTTP requests made to the server.
Work on multiple levels. Hashed static files should be served with long cache lives, use an HttpClient interceptor to cache repeated GET requests, and include @angular/service-worker to cache assets and select API data. A CDN will take care of the rest.
Layer 3: Rendering
9. Add SSR and Hydration for Speed and Crawlability
Client-side rendering will push an empty shell and render the page in the browser. Server-side rendering will push complete HTML upfront, which helps speed up the site and provides real content to crawlers. The previously Angular Universal-based server-side rendering is now present in the @angular/ssr module, which can be installed using the ng add @angular/ssr. If you want a starting point, read our notes on Angular SSR.
Combine with hydration to make the browser reuse the HTML from the server rather than rendering it again. Use withEventReplay() to capture early user events, and @defer to do incremental hydration.
This is also the core of optimizing Angular apps for Google crawling. Googlebot can render JavaScript, but rendering can be delayed and many other crawlers do not run it reliably. For landing, category and product pages, serve HTML from the server or prerender at build time, give each route a unique title, description and canonical tag through the Title and Meta services, and confirm the result in the Search Console URL Inspection tool.
10. Switch to OnPush Change Detection
Change Detection is a feature of the Angular framework that keeps track of each time an Angular application is changed. If any changes are detected in the specified @input parameters, the OnPush change detection strategy responds.
OnPush change detection performs checks on an Angular component only when there is a change in the input reference, an event fires within the component, or the signal that the component reads changes. This should be your default approach when building new components.
@Component({
  selector: 'app-order-list',
  changeDetection: ChangeDetectionStrategy.OnPush,
  templateUrl: './order-list.component.html'
})
11. Adopt Signals and Zoneless Change Detection
Signals tell Angular exactly what changed, so it can update only the affected parts of the view. Use computed for derived values and keep effect for real side effects. Zone.js currently triggers a check after any async event. Zoneless mode removes that dependency, so checks run only when signals, template events or markForCheck call for them.
Enable it with provideZonelessChangeDetection() in your app config. Test third party libraries that rely on Zone.js before switching a large app.
Our Angular team can modernize rendering step by step safely.
12. Use @for with track
The old *ngFor with trackBy has a built-in successor. The @for block requires a track expression, so Angular can reuse and move DOM nodes instead of destroying and recreating them.
@for (order of orders(); track order.id) {
  <app-order-row [order]="order" />
} @empty {
  <p>No orders yet.</p>
}
Track by a stable id, not the index, for lists that reorder. Older templates using *ngFor with trackBy still work and follow the same principles.
13. Understand Pure and Impure Pipes
Pure pipes only execute when the value or reference of the input changes, Angular caches the old output until another change detection cycle. As compared to pure pipes, impure pipes are more expensive since they execute during every change detection cycle. Thus, they should be used sparingly. Select pure and impure pipes based on their performance cost: use pure by default, use signals for logic, and use impure pipes sparingly.
Most commonly, dates, strings, and money quantities are transformed using the integrated pure pipes. Code readability within an Angular template is improved by the effective use of Angular pure pipes.
Layer 4: Measurement
14. Profile with Angular DevTools and Chrome DevTools
Angular DevTools is a browser extension for Firefox and Chrome that has a built-in profiler, which tracks the time of the change detection cycles, showing the components that have been checked. You can use Angular DevTools to identify the components that get re-rendered even though there are no changes and fix them by OnPush or signals. Chrome DevTools Performance view includes long tasks and layout cost, whereas the Network view uncovers big chunks.
By assessing the code and finding inefficient sections, you can make particular operations more efficient.
15. Set Up Angular Performance Monitoring and Track Core Web Vitals
Measure both lab and field data effectively. Lighthouse and Lighthouse CI catch regressions on every pull request, while tools like the web-vitals library, the Chrome UX Report, or a real user monitoring tool show what real users on actual devices experience. Google’s published targets for a good experience are Largest Contentful Paint at 2.5 seconds or less, Interaction to Next Paint at 200 milliseconds or less, and Cumulative Layout Shift at 0.1 or less, as outlined on web.dev.
Teams that create web applications at scale should wire budgets and Lighthouse checks into CI, so a heavy dependency fails the build before it reaches users. You can create web applications that stay fast only if someone owns the numbers.
Common Angular Performance Mistakes to Avoid
- Leaky subscriptions: live streams, timers, and listeners keep memory alive. Use async pipe, takeUntilDestroyed or DestroyRef for cleaning up.
- Mutating state under OnPush: the view will not be updated; hence, teams disable OnPush and lose its benefits.
- Function calls in templates: they run on every cycle. Instead use computed signals or pure pipes
- Dev settings in production: no budgets, source maps, and an unoptimized build will slow everything down.
- Duplicated code: copy-pasted code makes bundle size bigger. Use injectable services for moving common logic and sharing it through DI. The purpose of improving the speed of the Angular app is to reduce unnecessary code duplication and create clear and reusable code.
Why Choose CMARIX for Angular Performance Optimization?
CMARIX has built and tuned web applications since 2009, serving clients across 40+ industries. Our Angular development services cover performance audits, bundle and rendering fixes, SSR setup and upgrades to current Angular versions, delivered under ISO 9001:2015 and ISO 27001 certified processes. If you need extra capacity on an existing codebase, you can hire dedicated Angular Developers who work to your budgets, your pipeline, and your release cadence.
FAQs About Angular Performance Optimization
What is Angular performance optimization and why does it matter?
Angular performance optimization refers to the practice of reducing bundle sizes, lazy loading code and minimizing rendering to keep applications performant despite their growing size. It matters due to the negative impact on Core Web Vitals, SEO and conversions caused by poor performance. It will cost much less to optimize it at an early stage.
What are the core runtime features of Angular performance monitoring scripts?
Most monitoring scripts capture Core Web Vitals such as LCP, INP and CLS, route and navigation timings, long tasks, JavaScript errors and resource load times from real user sessions. Many also sample memory and tag data by device, network and release. Together these show which screens regress after a deployment.
How can developers systematically improve Angular performance across complex workspaces?
It all starts with measurement, and then goes from there in layers. Set a budget per app, use lazy loading, delay big components, use OnPush or Signals, and tackle the biggest problem first. If you have monorepo workspaces, enforce budgets and Lighthouse checks in CI per each app, and make sure that no big library leaks into every single build.
How does lazy loading in Angular minimize initial main bundle download delays?
In lazy loading, the route code is placed in individual parts which will be downloaded only if the user navigates to them. In this way, the initial bundle will contain only the necessary things for the first screen to be displayed, and thus the download will be faster.
What strategies exist for optimizing Angular apps for Google crawling and indexability?
Serve real HTML through server side rendering or development time prerendering, give each route a unique title, description and canonical tag, and keep key content out of blocks that load only after interaction. Use clean router URLs instead of hash fragments, and make sure robots rules do not block content. Confirm the results with the URL Inspection tool in Search Console.
How can engineering teams use Angular DevTools to audit change detection cycles?
Open the Profiler tab in Angular DevTools, record an interaction and review each change detection cycle by component. Components that are checked often but show no visible change are candidates for OnPush or signals. Record again after the fix to confirm the cycle time dropped.
What is the structural difference between pure and impure pipes regarding performance?
The pure pipe works only when the reference or the input value is changed, and the Angular framework uses the oldest calculated value. The impure pipe, defined by adding a pure: false statement, runs on every change detection, and an expensive operation may run many times.
How do you troubleshoot complex angular seo issues on dynamic e-commerce platforms?
Compare the raw HTML response with the rendered page to see what crawlers actually receive, then check that product data, titles, canonicals and structured data exist in the first response. Server render or prerender category and product pages, and avoid loading prices or descriptions only after client side API calls. Handle filter and parameter URLs with canonical tags to prevent duplicates.
What are the operational steps to configure build-level Angular optimization techniques?
Ensure that your project is using the application builder and the production optimization setting is turned on in angular.json. Also, make sure output file names include hashes and that source maps are turned off for production. Set initial bundle budgets which cause build failure. Run ng build –stats-json and check the analyzer report.
How do you address production memory leaks via an Angular performance audit blueprint?
Take heap snapshots in Chrome DevTools before and after repeated navigation, then compare retained objects to find components that never get cleaned up. Common causes are open subscriptions, timers and event listeners. Fix them with the async pipe, takeUntilDestroyed or DestroyRef cleanup callbacks, then repeat the snapshot test and add it to your audit checklist.
Frequently Asked Questions
- 1. How to Fix Angular Performance Issues?
- 2. How to Improve Angular Code Quality?
- 3. How to Increase Page Speed in Angular Applications?