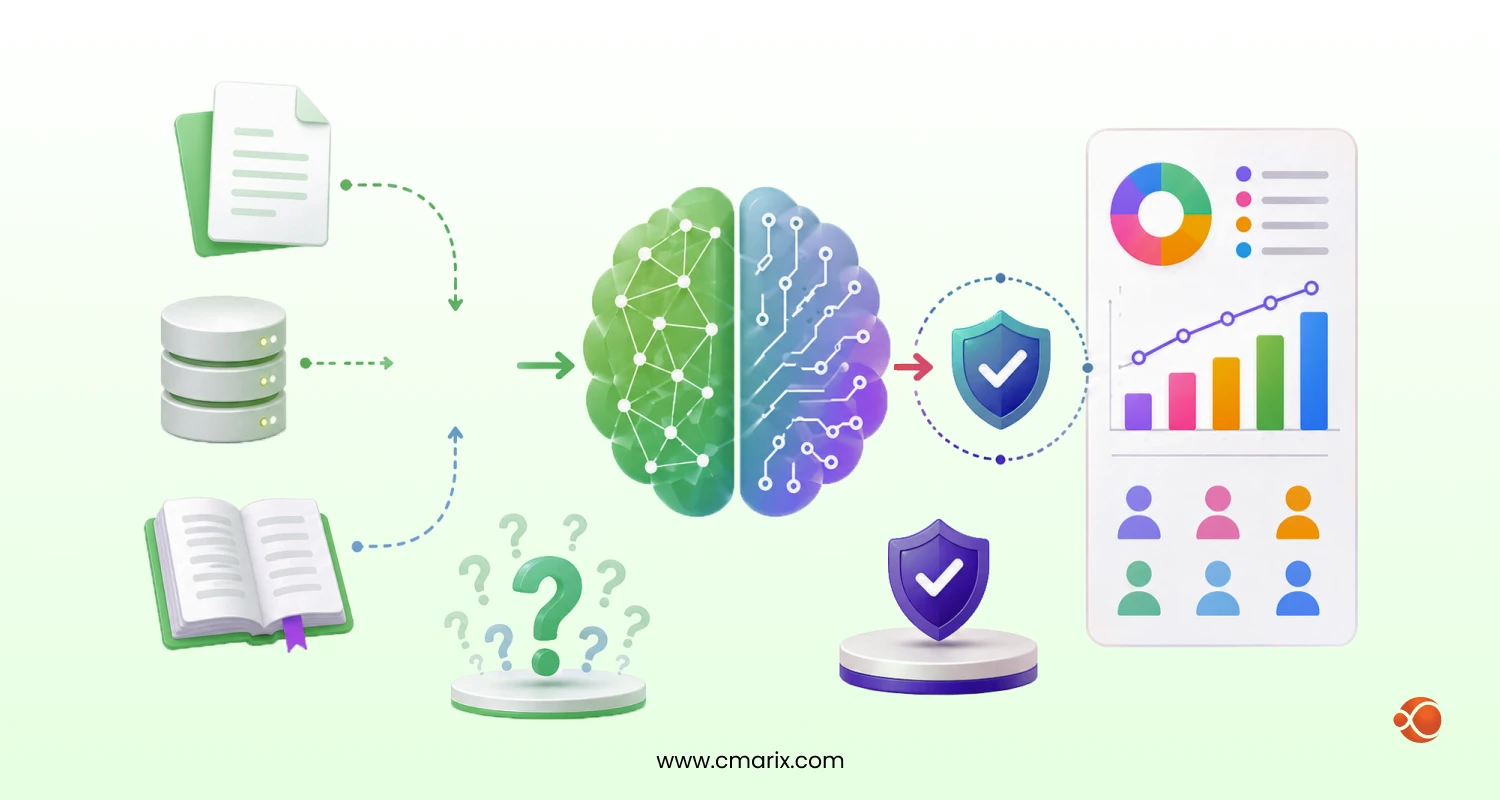
In today’s data-driven world, businesses need access to intelligent dashboards to not only display information but also provide actionable insights with the help of artificial intelligence. An AI-powered dashboard turns massive chunks of raw data into actionable strategic points with the help In today’s data-driven world, businesses need access to intelligent dashboards to not only display information but also provide actionable insights with the help of artificial intelligence.
An AI-powered dashboard turns massive chunks of raw data into actionable strategic points with the help of visually appealing and interactive interfaces. Today we will focus on how to build a powerful AI dashboard using React and MongoDB, what are the benefits of doing so, and careful considerations to keep in mind when implementing the same.
Whether you are a seasoned developer, an entry-level JavaScript developer, or an interested organization looking for ways to create AI-powered dashboards for your next project, this guide provides practical steps to create a fully functional, real-time dashboard with React and MongoDB integration. Let’s start with the fundamentals:
Understanding the AI Dashboard Architecture
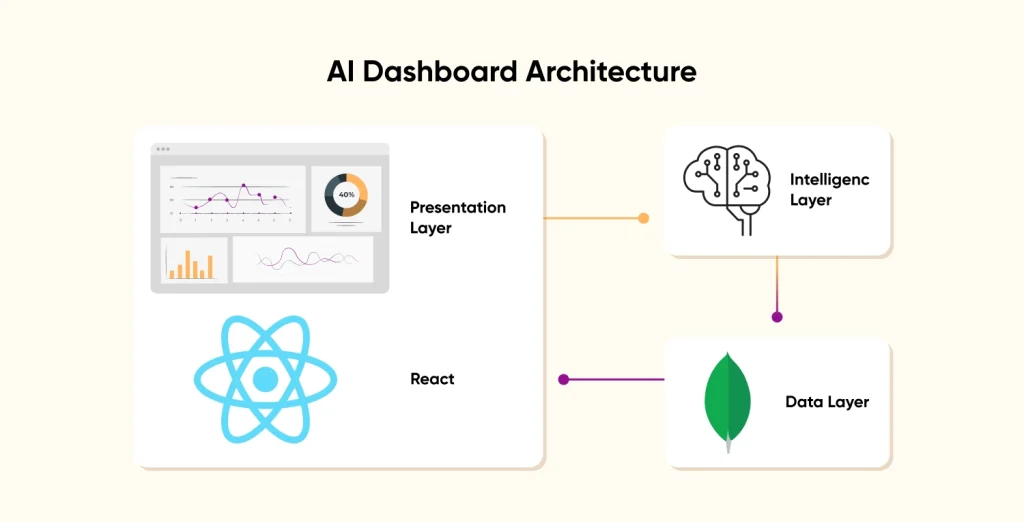
An AI dashboard can combine traditional benefits of data visualization with advanced machine learning capabilities to deliver intelligent insights and predictions. Such an architecture mainly works on three layers –
- Presentation Layer (React for Frontend)
- Data Layer (MongoDB as Database)
- Intelligence Layer (AI/ML Services)
Dividing responsibilities and having clear demarcation of function helps developers ensure scalability, maintainability, and efficient data processing.
Building a React dashboard with MongoDB setup offers many benefits over traditional alternatives. React uses a component-based architecture that makes modular development easier. MongoDB on the other hand has a flexible document structure which is needed to store diverse data types usually needed by AI algorithms.
When planning your AI dashboard development, it’s ideal to consider the kinds of insights you want to generate, such as predictive forecasting, user behavior analysis, or anomaly detection.
For businesses looking to accelerate development, working with experienced reactjs development services can significantly reduce time-to-market while ensuring optimal performance and user experience standards.
How to Setup Your AI-Dashboard Development Environment for React and MongoDB?
For developers who are eager to follow step-by-step tutorials on building AI-powered dashboards with React and MongoDB, you can directly jump there by clicking here. For those who want to understand the prerequisites of making this project work, we will cover all you need to know in this section.
Requirements for Setting Up AI-Dashboard Application with React and MongoDB
Must Haves
- Node.js (version 16 or higher)
- MongoDB(locally or via MongoDB Atlas)
- IDE/Code Editor (Visual Studio Code or any code editor of choice)
Additional (Good to Have)
- Git (for version control)
- Postman (for API Testing)
Recommended Project Structure
Creating a new project directory and initializing both frontend and backend applications works best when you separate concerns. The recommended structure separates the React client and Express server into distinct folders, making it easier to manage dependencies and allowing team members to work simultaneously on different components.
Essential packages include Create React App for project setup, Axios for making API calls, Chart.js for visualizations, and Material-UI for frontend styling.
For the backend, you’ll need Express.js, Mongoose for MongoDB integration, and various AI/ML libraries, depending on your requirements.
How to Setup MongoDB for AI-Driven Analytics?
MongoDB serves as the foundation for your AI-powered dashboard, storing both raw data and processed insights. The MongoDB backend for analytics requires careful schema design to optimize both read and write operations. It’s ideal to design your collections to support current dashboard needs and future AI enhancements.
javascript
// Example MongoDB Schema for Analytics
const analyticsSchema = new mongoose.Schema({ timestamp: { type: Date, default: Date.now, index: true }, userId: { type: String, required: true, index: true }, eventType: { type: String, required: true }, data: { category: String, value: Number, metadata: mongoose.Schema.Types.Mixed }, aiInsights: { predictions: [Number], confidence: Number, recommendations: [String] }
}, { timestamps: true });
This code will help you create a flexible schema that accommodates both current analytics data and future AI insights. The indexed timestamp and userID fields are useful for fast query performance, while the aiInsights object provides space for machine learning predictions and recommendations.
Implementing proper indexing strategies helps ensure fast query performance, especially for time-series data commonly used in dashboards. Compound indexes on timestamp and user ID fields can dramatically improve performance for dashboard filters and date range selections.
For teams requiring specialized expertise, it’s beneficial to hire MERN stack developers who understand both MongoDB optimization and React integration patterns for implementing advanced features like data partitioning and caching strategies.
How to Build a React Frontend for AI-Powered Dashboard Development?
The React frontend serves as the user interface for your AI dashboard, and it’s important to plan your components carefully for both functionality and performance. Creating a component hierarchy that separates layout components, data components for API integration, and visualization components for charts and graphs helps maintain clean code architecture.
State management becomes crucial in dashboard applications where multiple components need to share data and respond to real-time updates. Using React Context for global state like authentication and theme settings works well, while keeping component-specific state local helps maintain performance. For complex applications, it’s worth considering Redux or Zustand for managing application state.
javascript
// Example Dashboard Component Structure
import React, { useState, useEffect } from 'react';
import { DashboardLayout } from './components/Layout';
import { MetricsCard } from './components/MetricsCard';
import { AIInsightsPanel } from './components/AIInsightsPanel';
const Dashboard = () => { const [dashboardData, setDashboardData] = useState(null); const [loading, setLoading] = useState(true); useEffect(() => { fetchDashboardData(); }, []); const fetchDashboardData = async () => { try { const response = await fetch('/api/dashboard'); const data = await response.json(); setDashboardData(data); } catch (error) { console.error('Error fetching dashboard data:', error); } finally { setLoading(false); } }; return ( <DashboardLayout> <MetricsCard data={dashboardData?.metrics} /> <AIInsightsPanel insights={dashboardData?.aiInsights} /> </DashboardLayout> );
};
This code demonstrates a clean component structure where the main Dashboard component manages state and data fetching, while delegating rendering responsibilities to specialized child components. The useEffect hook handles initial data loading, and proper error handling.
Responsive design is needed for dashboards to be truly of value. It has to be functional and visually appealing across all devices like desktop, tablets, and mobile devices. The best react libraries for dashboard development include –
| Category | Library | Purpose / Features |
| UI Component Libraries | Material-UI (MUI) | Google’s Material Design components with responsive design |
| Ant Design | Enterprise-grade UI components with a polished look | |
| Chakra UI | Accessible, flexible components with theme support | |
| Tailwind CSS + Headless UI | Utility-first CSS framework with custom component styling | |
| Data Visualization | Recharts | Simple and responsive charts powered by D3 |
| Victory | Modular charting library for custom visualizations | |
| Nivo | Beautiful, customizable charts with animations | |
| react-chartjs-2 | React wrapper for Chart.js, easy to use | |
| React-vis | Visualization components developed by Uber | |
| State Management | Redux Toolkit | Official Redux toolset with simplified configuration |
| Zustand | Minimal state-management with simple API | |
| Recoil | Fine-grained state management by Facebook | |
| Routing | React Router | Declarative routing for single-page applications |
| Reach Router | Simple and accessible routing (now merged with React Router) | |
| Routing | React Query (TanStack) | Caching, background updates, pagination, and more |
| SWR | Lightweight data fetching with revalidation support | |
| Axios | Promise-based HTTP client | |
| Layout & Responsiveness | React Grid Layout | Draggable/resizable grid layout, ideal for dashboards |
| Framer Motion | Declarative animations and transitions | |
| React Resize Detector | Monitor element size changes | |
| Authentication | Firebase | Authentication + real-time database (great for MVPs) |
| Auth0 React SDK | Secure login, signup, and user sessions | |
| NextAuth.js | Full-featured auth for Next.js apps |

How to Integrate AI with MongoDB and React?
The integration of AI capabilities transforms a standard dashboard into an intelligent analytical dashboard AI tool. It’s ideal to start by identifying which AI features provide the most value: predictive analytics, anomaly detection, natural language processing, or recommendation systems.To Integrate AI with MongoDB and React, you’ll need to create API endpoints that process data through machine learning models and return insights to the frontend. This approach can involve real-time inference for immediate insights or batch processing for complex analytics.
javascript
// AI Integration Example
const AIService = { async getPredictions(data) { const response = await fetch('/api/ai/predictions', { method: 'POST', headers: { 'Content-Type': 'application/json' }, body: JSON.stringify({ data }) }); return response.json(); }, async generateInsights(parameters) { const response = await fetch('/api/ai/insights', { method: 'POST', headers: { 'Content-Type': 'application/json' }, body: JSON.stringify(parameters) }); return response.json(); }
};
This service layer abstraction helps maintain clean separation between your React components and AI functionality. The methods handle the HTTP communication with your AI endpoints and return processed results that can be easily consumed by your dashboard components.
It’s worth considering cloud-based AI services like Google Cloud AI, AWS SageMaker, or Azure Cognitive Services for advanced capabilities without managing ML infrastructure. For organizations requiring specialized AI capabilities, artificial intelligence development services can provide custom model development and integration expertise.
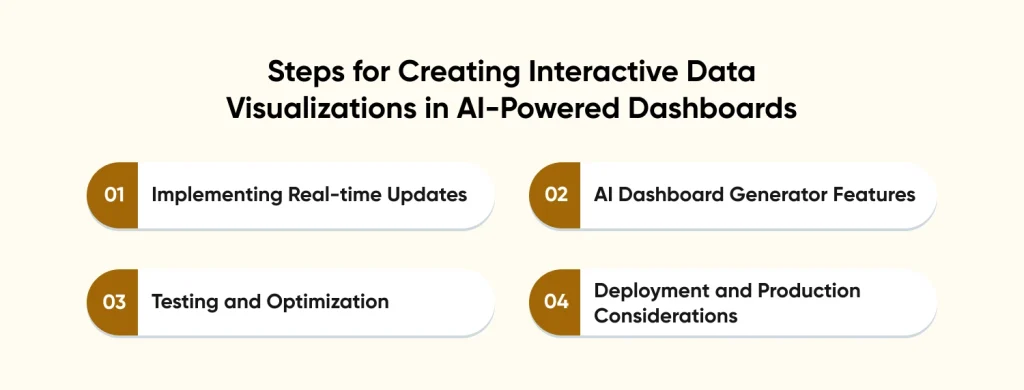
Steps for Creating Interactive Data Visualizations in AI-Powered Dashboards
It is important to understand how to build AI-powered visualizations that can adapt to user behaviour and highlight the most important metrics to them automatically. For this it is important to choose the right React visualization libraries that support both traditional charts and advanced interactive features. Here we will use Chart.js and D3.js for building interactive charts with unlimited customizations.
javascript
// Interactive Chart Component with AI Insights
import { Line } from 'react-chartjs-2';
const AIEnhancedChart = ({ data, aiInsights }) => { const chartData = { labels: data.labels, datasets: [ { label: 'Actual Data', data: data.values, borderColor: 'rgb(75, 192, 192)', }, { label: 'AI Predictions', data: aiInsights.predictions, borderColor: 'rgb(255, 99, 132)', borderDash: [5, 5], } ], }; return <Line data={chartData} options={options} />;
};
The above component demonstrates how to combine actual data with AI predictions in a single visualization. The dashed line style for predictions helps users distinguish between historical data and AI-generated forecasts. The color coding gives immediate visual context.
Implementing progressive disclosure in visualizations works well when you start with high-level summaries and allow users to drill down into detailed views. AI can help by automatically identifying important data points and suggesting relevant drill-down paths.
Implementing Real-time Updates
A real-time dashboard with MongoDB requires careful orchestration of data flows and WebSocket connections. It’s beneficial to implement WebSocket connections using Socket.io for bidirectional communication between your React frontend and Node.js backend, which enables instant data updates without polling.
javascript
// Real-time Dashboard Implementation
import { useEffect, useState } from 'react';
import io from 'socket.io-client';
const useRealTimeDashboard = () => { const [socket, setSocket] = useState(null); const [dashboardData, setDashboardData] = useState({}); useEffect(() => { const newSocket = io('http://localhost:5000'); setSocket(newSocket); newSocket.on('dataUpdate', (data) => { setDashboardData(prevData => ({ ...prevData, ...data })); }); return () => newSocket.close(); }, []); return { dashboardData, socket };
};
By using this custom hook, developers can encapsulate the WebSocket logic. This provides a clean interface for components to get real-time updates. The hook can automatically handle connection and data merging.
MongoDB Change Streams watch for changes in the database and update things right away. This lets the dashboard show the latest data without needing to refresh, which is great for real-time use.
AI Dashboard Generator Features
An effective AI dashboard generator helps create dynamic, adaptive interfaces that evolve based on user needs and data patterns. Implementing automated layout generation where AI algorithms analyze data types and user behavior to suggest optimal dashboard arrangements works particularly well for improving user experience.
javascript
// AI Dashboard Generator Component
const AILayoutGenerator = ({ data, userPreferences }) => { const [generatedLayout, setGeneratedLayout] = useState(null); const generateLayout = async () => { const response = await fetch('/api/ai/generate-layout', { method: 'POST', headers: { 'Content-Type': 'application/json' }, body: JSON.stringify({ dataSchema: data.schema, userPreferences }) }); const layout = await response.json(); setGeneratedLayout(layout); }; return ( <div className="ai-layout-generator"> <button onClick={generateLayout}>Generate Smart Layout</button> {generatedLayout && ( <button onClick={() => applyLayout(generatedLayout)}> Apply Layout </button> )}
</div> );
};
This component is used for demonstration of AI capabilities in dashboard design. It analyzes data patterns and user preferences for providing optimal layouts. The two-step process gives the users the ability to preview AI recommendations before applying them. This gives them more control and makes them feel more confident about the AI assistance.
A natural language interface can be added to make dashboards more accessible. Imagine a dashboard that allows the users to raise queries in plain english and get relevant visualizations as response. With efficient NLP services, user queries can be automatically translated to appropriate charts or data views works, which is ideal for non-technical users.
Testing and Optimization
Thorough testing helps ensure your AI dashboard performs reliably and provides accurate insights. Testing AI-powered applications requires a multi-layered approach that includes unit tests for components, integration tests for AI service connections, and end-to-end tests for complete user workflows.
It’s important to implement performance testing specifically for dashboard loading times, real-time update handling, and AI processing delays. Using tools like Lighthouse for web performance auditing and custom monitoring for AI processing times helps maintain optimal user experience.
javascript
// Performance Monitoring for AI Dashboard
const usePerformanceMonitoring = () => { const trackAIProcessingTime = async (operation, data) => { const startTime = performance.now(); const result = await operation(data); const endTime = performance.now(); console.log(`${operation.name}: ${endTime - startTime}ms`); return result; }; return { trackAIProcessingTime };
};
This monitoring hook keeps track of how much time different operations take. It spots patterns that allow developers to fine-tune AI services and deliver a smoother, more responsive experience for users.
It’s also important to carefully check the quality of the data that AI algorithms rely on. Since this data feeds into dashboard insights, it needs to be accurate and complete. A good approach is to run multiple validation checks to make sure everything is reliable before generating insights.
Deployment and Production Considerations
Rolling out an AI-powered dashboard takes thoughtful planning—especially for aspects of scalability, security, and reliability. Using tools like Docker for containerization helps keep environments consistent, whether you’re in development or production.
It’s also smart to pick a cloud platform that fully supports your tech stack, including any AI or machine learning services you’ll be using. That way, everything works smoothly together from day one.
javascript
// Production Configuration
const productionConfig = { mongodb: { uri: process.env.MONGODB_ATLAS_URI, options: { maxPoolSize: 10 } }, aiService: { endpoint: process.env.AI_SERVICE_ENDPOINT, timeout: 30000 }
};
This shows how environment variables can manage different deployment scenarios while protecting sensitive data. Settings like connection pooling and timeouts are important to ensure all things run smoothly, especially in production.
To maintain high service quality, it’s important to have solid monitoring in place. Application Performance Monitoring (APM) tools can track things like response times and error rates, while dedicated monitors for AI processes—such as processing time and prediction accuracy—help keep your models performing reliably.
AI-Powered Dashboard Development: Advanced Features and Best Practices
Advanced AI data insights dashboard features can significantly enhance user experience and provide competitive advantages. It’s worth considering collaborative features where users can share insights and create shared dashboard views. AI can help facilitate collaboration by suggesting relevant team members for specific insights.
AI for dashboard design extends beyond visualization to include intelligent UI adaptation. Implementing features like automatic theme adjustment, adaptive layouts based on usage patterns, and predictive prefetching of data users are likely to explore helps create more intuitive experiences.For complex implementations, it’s beneficial to use semantic ui react for consistent interface components.
Why Hire AI Developers from CMARIX?
Organizations scaling their AI dashboard initiatives often find it helpful to hire ai developers with dashboard experience for implementing advanced features like real-time model retraining and intelligent data pipeline optimization. We at CMARIX, have skilled AI developers with expertise in AI-driven dashboard, web application and mobile app development to offer a complete AI-driven solution. Here is a glimpse of our capabilities –
End-to-End AI Dashboard Development
We build complete AI dashboards from start to finish. Our team uses MongoDB for a fast backend and React to create smooth, user-friendly interfaces. AI features are fully built in and work seamlessly.
Custom Machine Learning Integration
We create and deploy machine learning models that fit your business needs. This way, your dashboard gives useful insights and not just basic reports.
Real-time Performance Optimization
Our team uses smart caching, WebSockets, and efficient data pipelines. These keep the dashboard fast, even when running complex AI tasks often with sub-second response times.
Scalable AI Architecture Design
We build dashboards that grow with your business. Using cloud tools, microservices, and modular AI parts, we make sure everything is easy to update and scale over time.
Final Words
Building an AI dashboard with React and MongoDB creates a powerful foundation for intelligent data visualization. This guide covered essential components from development setup to ai integration, resulting in scalable dashboard applications that actively help users discover insights and make informed decisions.
FAQs on Building AI-Powered Dashboards with React and MongoDB
What is an AI-powered Dashboard?
An AI dashboard is a data visualization interface that uses AI and ML capabilities to automatically analyze data, generate insights, and provide predictive analytics. It goes beyond traditional static charts by offering intelligent recommendations, anomaly detection, and automated data interpretation to help users make informed decisions.
How to Build AI Dashboards using MongoDB and React?
Build AI dashboards by using MongoDB to store and aggregate your data, react for the frontend interface with visualization libraries like Recharts or D3.js, and integrate AI services through APIs or machine learning models. connect your react components to MongoDB through a backend API (Node.js/Express) that processes data and feeds AI-generated insights to your dashboard components.
Why use React and MongoDB for Creating Dashboards?
React provides a component-based architecture perfect for building interactive, responsive dashboard interfaces with excellent state management and real-time updates. MongoDB offers flexible document storage ideal for handling diverse data types, powerful aggregation pipelines for data processing, and seamless integration with JavaScript-based applications through its native drivers.
Can I Create Real-time Dashboards using MongoDB and React?
Yes, you can create real-time dashboards by implementing MongoDB change streams to monitor data changes and using WebSockets or Server-Sent Events to push updates to your react components. This combination allows your dashboard to automatically refresh and display live data as it changes in the database without requiring manual page refreshes.