Mobile Overview: The 2026 mobile ecosystem is entering its most disruptive phase yet, and CMARIX brings a frontline perspective on this shift. This overview of 80+ mobile app development statistics reveals how fast the industry is evolving, where users are spending their time and money, and which technologies will dominate product roadmaps.
The mobile application landscape is accelerating at unprecedented rates. As we move into 2026, analyzing the momentum built in 2025 and the projections shaping the future will be the most essential tools for anyone who plans to compete in the digital ecosystem. Mobile apps have evolved into indispensable digital companions, commerce hubs, entertainment centers, and the primary interface for everyday tasks.
For businesses, developers, founders, and marketers striving for growth in 2026, success depends on recognizing the statistical truths that reveal the scale, direction, and opportunities in the mobile industry. Here are 80+ powerful statistics gathered by CMARIX mobile app developers, covering market growth, user behavior, monetization, and emerging technology trends.
Let's build a high-performance app that drives measurable growth.
Contact UsPart I: The Massive Mobile App Market and Growth Projections for 2026
The mobile application economy continues to soar, driven by global smartphone growth and evolving digital consumption habits. These mobile app stats highlight the scale of the coming growth wave.
Market Size and Trajectory
The mobile application ecosystem continues to expand at a record pace, shaped by AI adoption, platform maturity, and the rising expectations of digital-native users. As a leading mobile app development company, CMARIX continues to see increased demand for enterprise-grade mobile applications powered by AI, automation, cloud technologies, and cross-platform frameworks.
- The global mobile application market was valued at USD 252.89 billion in 2023.
- The industry is projected to reach USD 626.39 billion by 2030.
- Global app revenue is expected to grow from 522.7 billion in 2024 to 673.7 billion by 2027.
- In 2024, mobile apps are expected to forge a total revenue of USD 935 billion.
Global and Regional Dominance Mobile App Growth

- The US mobile app market is projected to grow at a CAGR of 14.1 percent through 2030.
- The UK accounted for over 26 percent of the European mobile app market revenue in 2023.
- The Middle East and Africa market is expected to reach USD 26.04 billion by 2030.
- Asia Pacific led the mobile app market in 2023 with more than 32 percent revenue share.
- China’s market will grow even faster with a projected CAGR of 15.8 percent.
As you can see, you can find different mobile app users in different demographics, with more demand for a particular product in one, and others in another.

Key Drivers Fueling the Surge in Mobile App Development
| Key Driver | Description |
| Rising Smartphone Adoption and Consumer Reliance on Apps |
|
| AI, Automation, and Advanced Technologies |
|
| Faster Development and 5G Connectivity |
|
| Monetization Potential and Competitive Pressure |
|
Part II: AI Mobile App Development Statistics
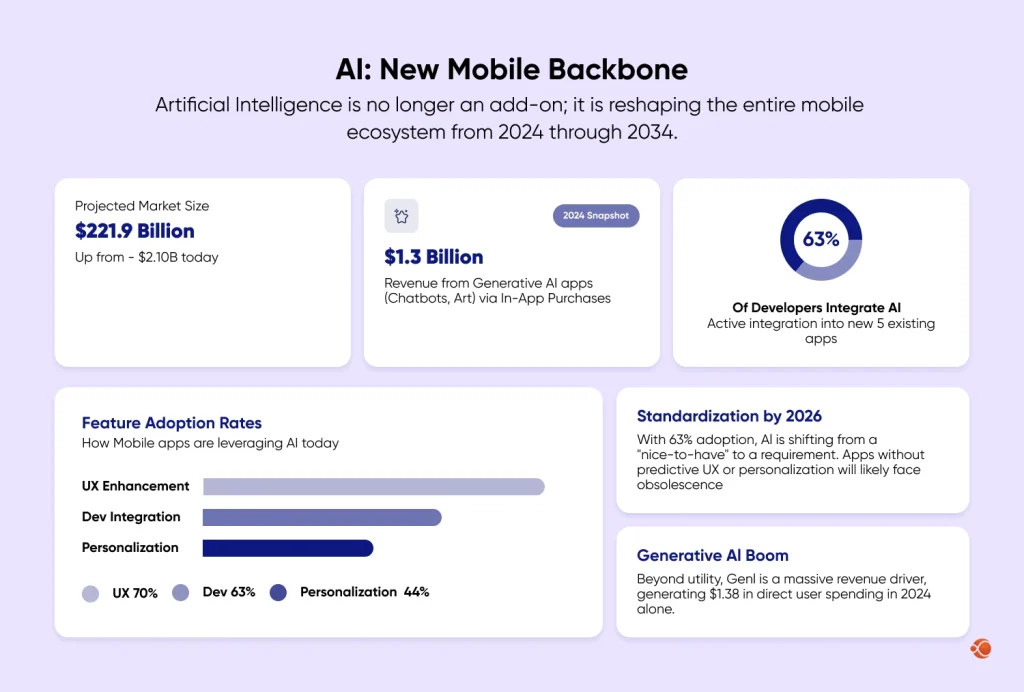
Before exploring downloads and app performance, it is important to understand the new force shaping the entire mobile ecosystem: AI. AI is no longer an add-on; it is the backbone of modern apps across personalization, recommendations, automation, search, and predictive UX.
Here are some of the defining stats that show the impact of AI on mobile app development in 2026:
- The global AI mobile app development market size is estimated to reach USD 221.9 billion by 2034.
- 63% of mobile app developers integrate AI features into their apps.
- 44% of mobile apps use AI personalization to deliver tailored content.
- 70% of mobile apps use AI features to improve user experience.
- The AI industry in the app space is valued at around $210 billion.
Global Downloads and User Base
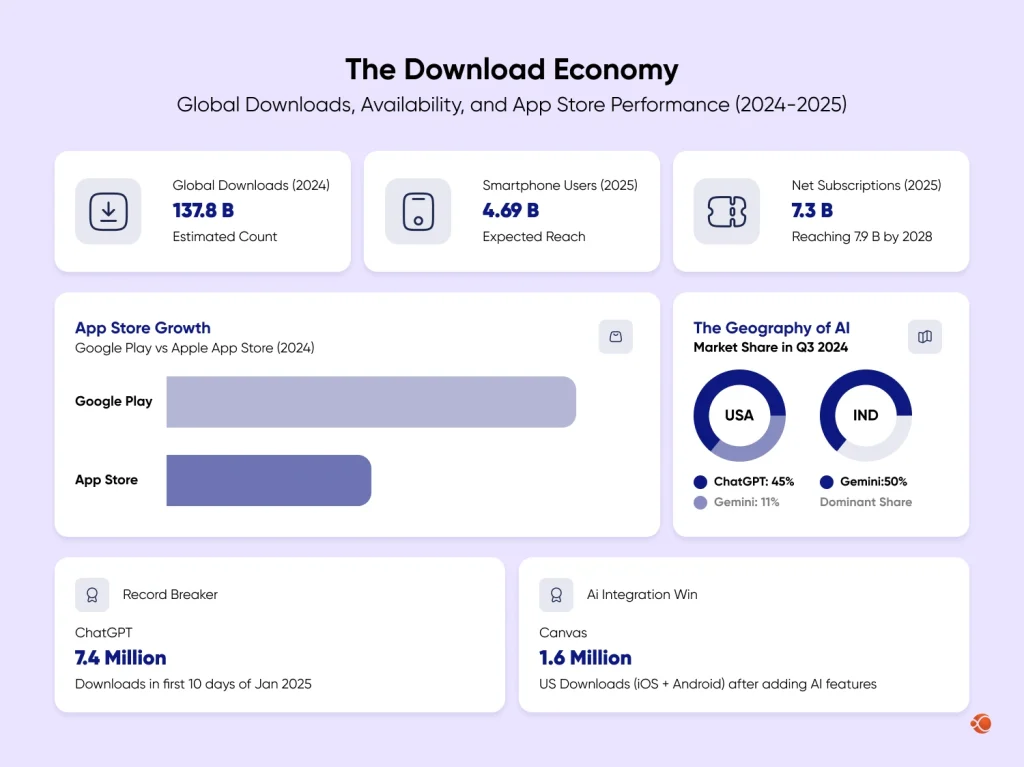
- Global app downloads were estimated at 137.8 billion apps in 2024.
- Google Play Store saw a 31% increase in mobile app downloads, whereas Apple App Store recorded only a 2.5% growth rate.
- By 2025, the global smartphone user base is expected to reach 4.69 billion.
- Smartphone network subscriptions reached nearly 7.3 billion in 2025, and are expected to reach 7.9 billion by 2028.
- ChatGPT saw almost 7.4 million downloads during its first 10 days of initial release, as of January 2025, making it the leading gen AI app to gain so many downloads.
- During Q3 of 2024, ChatPT had a market share of 45% in the US, compared to 11% for Gemini, whereas in India, Gemini had over 50% of the market share.
- Canva saw around 1.6 million downloads among US users across Android and iOS as it added AI features.
“These mobile app insights reflect the shift toward intelligent app ecosystems,” notes CMARIX experts, who frequently optimize the mobile app development process for AI-centric products.
Get the best native and native mobile app development services.
Hire App Developers in IndiaPlatform Competition and App Store Availability
- Google Play Store downloads will hit an estimated 143 billion by 2026.
- The Apple App Store is expected to reach 38 billion downloads by 2026.
- The App Store currently earned around 1.3 trillion in billing and sales during 2024.
- The global mobile operating system market share currently has Android with 72.55% of market share, iOS with 27.04%, Samsung with 0.222% and so on.
These Android and iOS app statistics underscore the competition between platforms and the scale developers must consider when planning releases.
Part IV: Deep User Engagement and Mobile Application Statistics
In 2026, engagement is the real battleground. The numbers below reveal how deeply mobile apps dominate modern digital habits. Here are some key mobile application usage statistics:
Time Spent and Usage Behavior
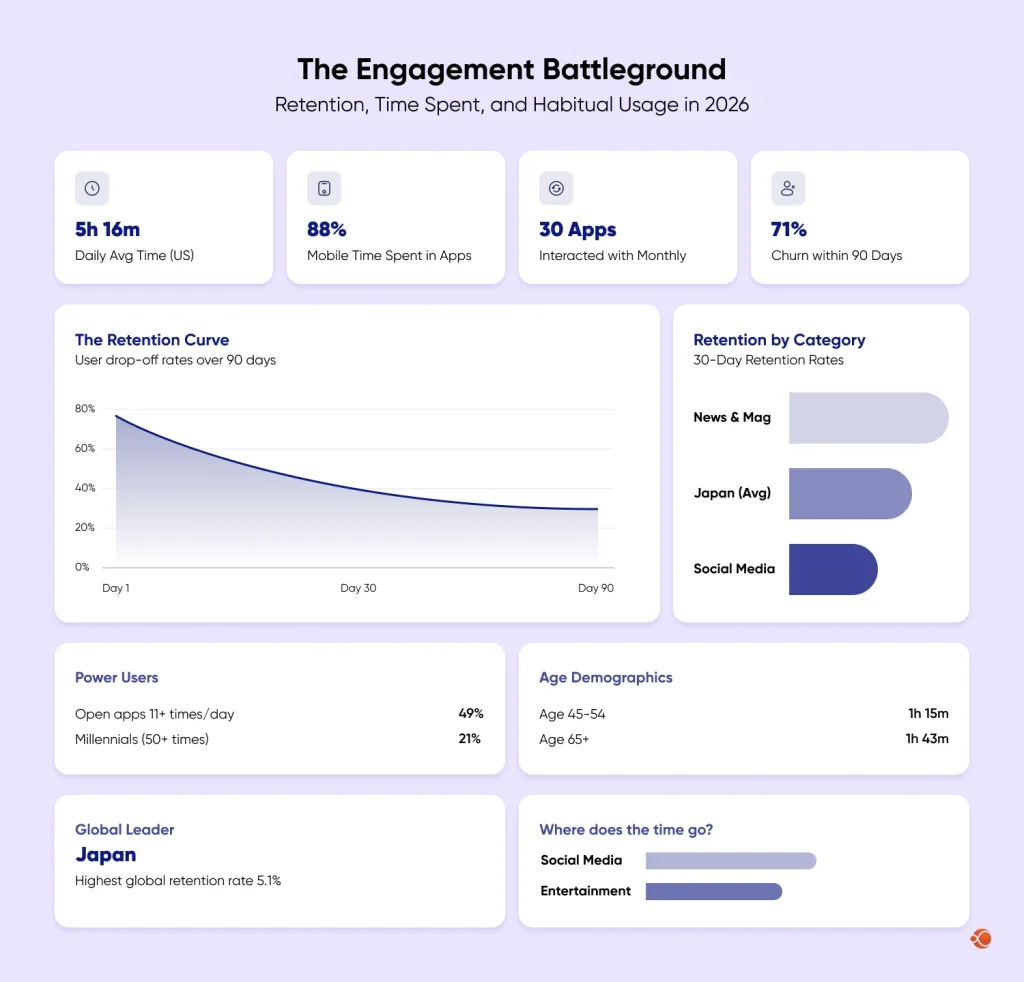
- Users spend around 88% of their mobile time in apps.
- An average American spends around 5 hours and 16 minutes on their phone.
- 70 percent of all digital media time in the US comes from mobile apps.
- Up to 90 percent of overall online time is spent within mobile apps.
- Users interact with around 30 different apps each month.
Habitual Usage and Demographics
- 49% of users open an app more than 11 times per day.
- 21% of Millennials open an app 50 or more times daily.
- 51 percent of users check their apps one to ten times per day.
- Users aged 45 to 54 spend 1 hour and 15 minutes per day on mobile apps.
- Users over 65 spend nearly 52 hours per month on apps, about 1 hour and 43 minutes per day.
- In 2024, more than 35% of users’ time on mobile devices was spent on social media apps, followed by entertainment apps at 32.7%.
App Retention Rates and Churn
- 71 percent of users churn within 90 days of installing an app.
- 25% abandon an app on the very first day.
- 59.71% of social media apps were uninstalled within the first 30 days.
- Social media apps have the lowest 30-day retention rate at 1.37%.
- News and magazine apps have the highest retention at 9.1%.
- Japan leads globally with the highest retention rate at 5.1 percent.
For companies evaluating mobile app development costs, retention metrics help prioritize long-term optimization strategies over one-time build efforts.
Part V: The Money Trail and App Monetization Trends
Monetization continues to evolve, but free apps still dominate global revenue. Here is what 2026 will look like.
Revenue Streams and Consumer Spending
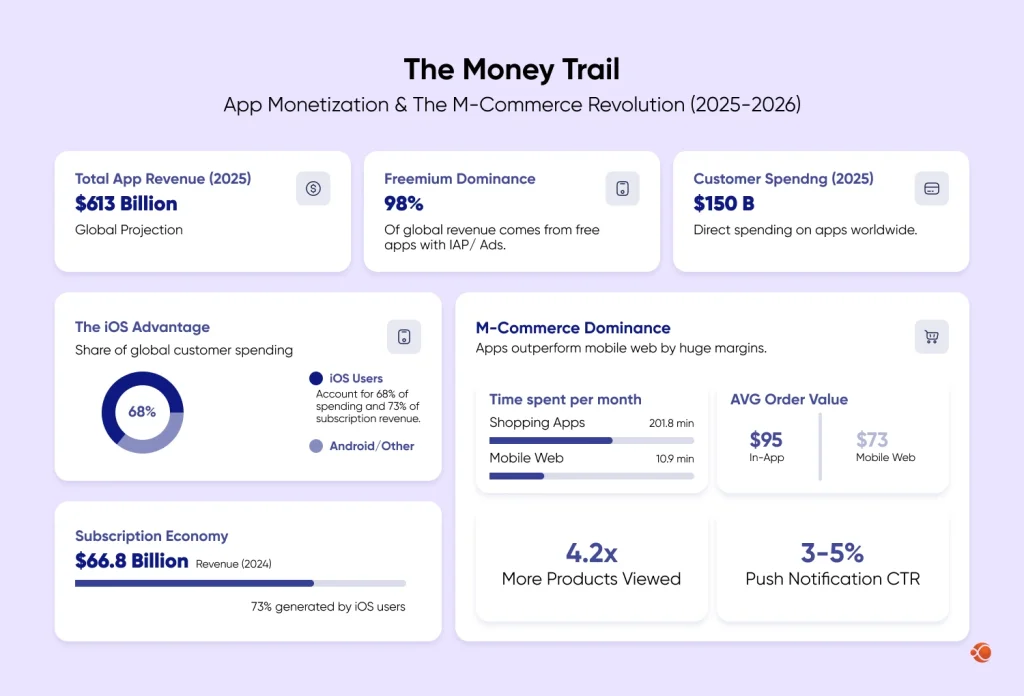
- Mobile app revenue is expected to reach USD 613 billion in 2025.
- Consumer spending on apps will hit USD 150 billion in 2025.
- 98 percent of global mobile app revenue comes from freemium apps.
- iOS accounts for 68 percent of global app consumer spending.
- iOS has contributed 75% of total app spending to date.
- In Q3 2021, the App Store generated USD 21.5 billion in revenue versus Google Play’s USD 12.1 billion.
- Subscription revenue reached USD 66.8 billion in 2024.
- About 73 percent of subscription revenue comes from iOS users.
- In Q2 of 2025, total combined Apple App Store and Google Play Store spending amounted to USD 40.9 billion.
These statistics guide brands in choosing the right mobile app monetization strategies, including subscriptions, ads, and hybrid models.
The M Commerce Revolution
- The global market share for mobile commerce is estimated to reach USD 14 billion by 2023.
- More than 60 percent of shoppers prefer mobile apps over mobile websites.
- 76.5 percent of US smartphone users regularly use shopping apps.
- 78 percent of global consumers shop through mobile apps.
- App users spend 201.8 minutes per month on shopping apps VS 10.9 minutes on mobile websites.
- App users browse 4.2 times more products per session compared to web users.
- Customer lifetime value is 2.8 to 5 times higher for app users.
- App’s average order value is 10 to 50 percent higher than mobile web.
- App users spend USD 95 per order VS USD 73 on mobile websites.
- Abandoned cart push notifications have CTRs of 3-5%.
- Push notification conversion rates typically range from 1.5 to 4 percent.
For brands working with a mobile app development company, these insights help align product roadmaps with the latest mobile app industry trends.
Part VI: What is the Current and Future State of Mobile App Development Across Different Industries
Mobile apps no longer offer one-size-fits-all. Different industries experience unique growth patterns, user engagement, and monetization trends. Understanding industry-specific mobile app statistics helps you get the most efficient mobile app solutions that maximize ROI, enhance customer engagement, and leverage emerging AI-driven trends.
Retail and E-Commerce Mobile App Stats
- Over 73% of global consumers prefer shopping via mobile apps rather than mobile websites.
- App users spend an average of 201.8 minutes per month on shopping apps, compared to just 10.9 minutes on mobile web.
- Average order value via apps is 10–50% higher than on mobile websites, with app users spending USD 95 per order, compared with USD 73 on mobile websites.
Healthcare and Telemedicine Apps
- 55% of patients prefer booking appointments via mobile apps.
- Telemedicine app downloads are projected to grow by 28% annually through 2026.
- AI-driven symptom checkers and virtual care features improve patient engagement by over 40%.
Finance and FinTech Apps
- Mobile banking apps account for 65% of global financial transactions.
- FinTech app users open apps an average of 12 times per day, with Millennials leading frequent engagement.
- AI-powered features such as fraud detection and personalized budgeting are integrated in 58% of top FinTech apps.
Education and E-Learning Apps
- Over 70% of learners report using mobile apps for study or skill development.
- Educational apps with AI personalization achieve up to 50% higher retention than those without it.
- Monthly active users of e-learning apps are projected to surpass 1.2 billion by 2026.
Travel and Hospitality Apps
- 61% of travelers prefer using mobile apps to book flights, hotels, and experiences.
- Push notifications for travel updates achieve 4–6% higher engagement than email.
- AI-powered travel recommendations increase in-app bookings by 32%.
Entertainment and Media Apps
- Users, on average, spend around 2.5 hours per day on entertainment apps.
- Streaming apps with AI-driven content suggestions see 35% higher retention.
- Gaming apps accounted for over 50% of total app downloads in 2025.
Key Trends That Are Shaping the Future of Mobile App Development in 2026 and Beyond
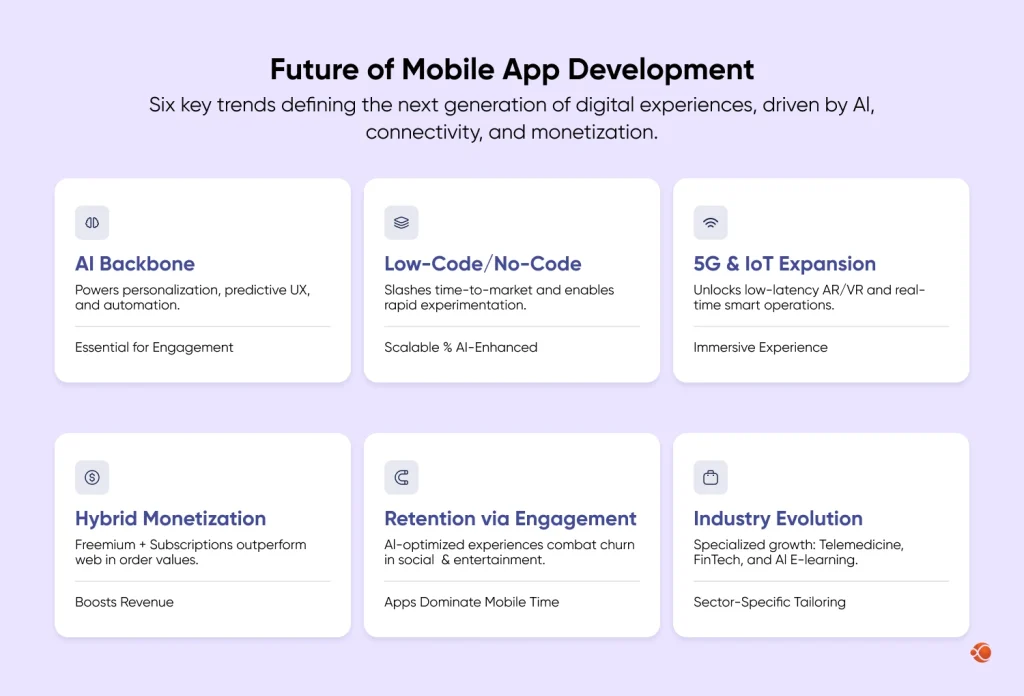
- AI Backbone for Apps: AI powers personalization, predictive UX, chatbots, and automation, becoming essential for engagement in e-commerce, telemedicine, and financial services.
- Low-Code/No-Code Shift: Enables rapid development and experimentation, slashing time-to-market while supporting scalable, AI-enhanced apps.
- 5G and IoT Expansion: Unlocks low-latency AR/VR, streaming, and connected devices for immersive, real-time experiences in gaming and smart operations.
- Monetization via Freemium and Subscriptions: Hybrid models boost revenue through in-app purchases and m-commerce, outperforming web in retention and order values.
- Retention Through Engagement: Apps dominate mobile time; AI-optimized experiences combat churn, especially in social media and entertainment.
- Industry-Tailored Evolution: Retail prioritizes shopping apps; healthcare telemedicine surges; FinTech handles transactions; e-learning personalizes via AI for higher retention.
What These Statistics Mean for Businesses in 2026
The mobile application landscape is now the core of digital strategy. A professional mobile app development company that can help in getting actionable, data-driven mobile apps, for which you’d get a detailed report that defines the success of your app against industry benchmarks, your milestones, and competitors’ apps.
- Track performance to boost business results: Measure how your app is performing to make smart adjustments that drive better outcomes.
- Plan your market entry to seize new opportunities: Strategically position your app to tap into fresh markets and grow your customer base.
- Target the right audience for greater impact: Identify key demographics and engage users most likely to convert and stay loyal.
- Refine monetization to boost revenue: Focus on smart strategies to increase your app’s earning potential without compromising user experience.
- Reduce churn by solving user pain points: Understand what’s driving customers away and address the issues that keep them from coming back.
- Enhance retention with personalized experiences: Create tailored experiences and loyalty programs that make users feel valued and encourage long-term engagement.
- Use AI to improve user satisfaction: Integrate AI-powered features that deliver smarter, more intuitive interactions, making your app more valuable to users.
- Maximize customer lifetime value: Build long-lasting relationships with users, ensuring they continue to engage with your app over time and drive sustainable growth.
Understanding these app statistics is important for improving your overall strategy. It will help teams decode their overall mobile app development costs, improve app performance, make their apps more future-ready, and produce more accurate estimates.
Get the Most out of Mobile App Development with CMARIX
It is important to build or modernize mobile apps for startups, SMEs, and enterprises that can benefit from the modern technological advancements and capabilities. If you are planning to build a new app for iOS and Android, or are having trouble keeping up with customer or internal business needs with your existing mobile app solution, reach out to the dedicated experts at CMARIX to get the most out of your mobile app investment.
So if you are looking to build a future-ready mobile app that scales and automates most tasks, we are more than happy to help.
We have a team of native app developers (Swift/Kotlin) as well as cross-platform development experts in Flutter, React Native, and other leading technologies. With a team of more than 240+ professional iOS developers, 2000+ projects, and serving clients from over 46+ countries, we assure you, your project is in the most capable hands.
Our dedicated iOS and Android app developers and testers have also worked with various clients from different industries and domains, enabling us to provide subject matter expertise to clients from any industry and help them with their compliance requirements. Unlock unmatched excellence with our innovation-driven mobile app solutions.
Get in touch with our mobile app consultants and redefine what’s possible!
FAQs on Mobile App Development Statistics in 2026
What are the most important mobile app development statistics for 2026?
We have noticed record-high engagement, faster AI adoption, and rising in-app spending as defining moments in mobile app statistics. Downloads across all app categories have grown tremendously, driven by personalization and automation.
What industries are investing the most in mobile apps in 2026?
Sectors with high digital adoption are leading the charge. Most industries rely on real-time data and user engagement. Here are some sectors that are investing the most in mobile app development:
– Finance & fintech
– Healthcare & wellness
– Retail & eCommerce
– Entertainment, gaming, and streaming
– Travel and on-demand services
These sectors continue to scale their mobile budgets as user expectations rise and competition increases. With AI-driven personalization, faster development cycles, and higher engagement potential, these industries are focusing on mobile apps as the main channel for scalability.
How much revenue does the mobile app industry generate in 2026?
Global mobile app revenue continues to surge as in-app purchases, ads, and subscription models expand. The industry crosses multi-hundred-billion levels, driven heavily by gaming, fintech, and video apps. AI features have also made more users willing to spend on platforms.
Why should businesses care about mobile app statistics in 2026?
Mobile insights provide direction and ideas on how consumers spend most of their time, what drives user retention, and other important aspects. These numbers help brands plan investments, optimize digital experiences, and stay aligned with changing customer expectations across devices.
What technologies are trending in mobile app development in 2026?
Tech is moving fast, helping companies build apps that are quicker, smarter, and feel more natural and fun to use.
Key technologies that are shaping mobile app development in 2026 include:
– AI that automates tasks and predicts what users want next.
– Cross-platform tools like Flutter and React Native allow you to build once and run on all devices.
– 5G for super-fast, lag-free experiences.
– AR/VR to create exciting, lifelike adventures.
– Low-code tools and backend helpers for easy, speedy building.
Together, these technologies are redefining how modern apps are built, deployed, and scaled. Companies are prioritizing faster releases, smarter personalization, and richer interactions. This makes 2026 a year when mobile apps are getting more intuitive, adaptive, and immersive than ever before.
What is the average user retention rate for mobile apps in 2026?
User retention remains a major concern for mobile apps as competition increases. Most apps struggle to keep users on their app beyond the first 30 days. Apps with strong onboarding, personalization, and AI-driven recommendations perform considerably better.